You can monitor key system metrics in real time using the BRIX365-Overview dashboard.
It consists of the following workspaces:
- BRIX365.
- BRIX365 – Telemetry.
- Kubernetes Cluster.
- Pods info.
- Nodes info.
- Postgres.
- RabbitMQ.
- MongoDB.
- Cache.
- Ingress.
- Logs.
- Linkerd.
- Kubernetes Events – Stats.
Preliminary settings for the system performance dashboard
For correct operation of the dashboard, pre-install and configure the monitoring tools according to the following articles:
- Install monitoring tools — Prometheus и Grafana for storing and displaying data.
- Monitoring of databases — DBSExporter to collect metrics of databases.
- Monitoring of business processes — to enable metrics of business processes, enable dashboards.enabled prarameter in the values-brix365.yaml file.
- Event monitoring — Kubernetes Event Exporter to analyze Kubernetes cluster events.
- Install Loki — to collect and store system operation logs.
- Install Linkerd (optional) — to configure a service mesh for monitoring service connections and their parameters.
As soon as these configurations are ready, data for the dashboard will be collected in Prometheus and displayed in Grafana.
Let’s take a closer look at the contents of the BRIX365-Overview workspaces.
BRIX365 workspace
Here you can see charts that help you evaluate system stability, request processing speed, and script execution efficiency.
System monitoring is divided into two key sections:
- API performance analysis.
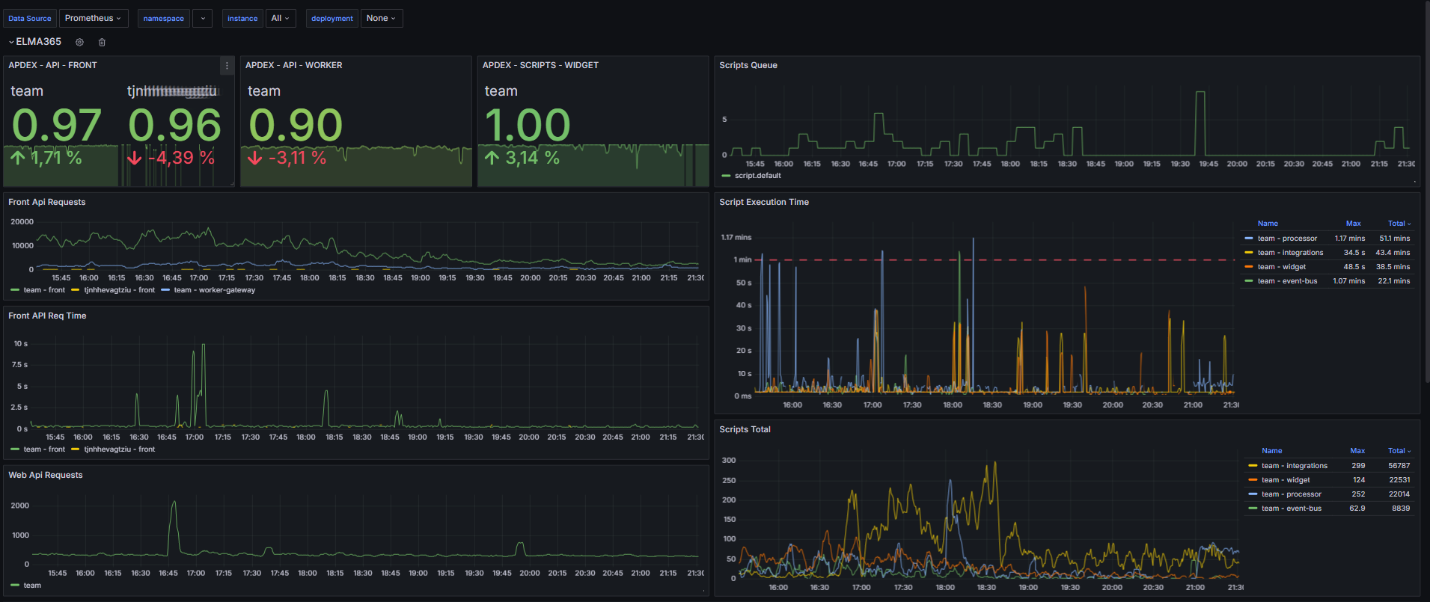
The graphs show how many requests are incoming and how long they take to process. If the number of requests remains constant but their execution time increases, check the availability of dependent services and the database. Optimize your requests to databases as well.
- Script execution statistics.
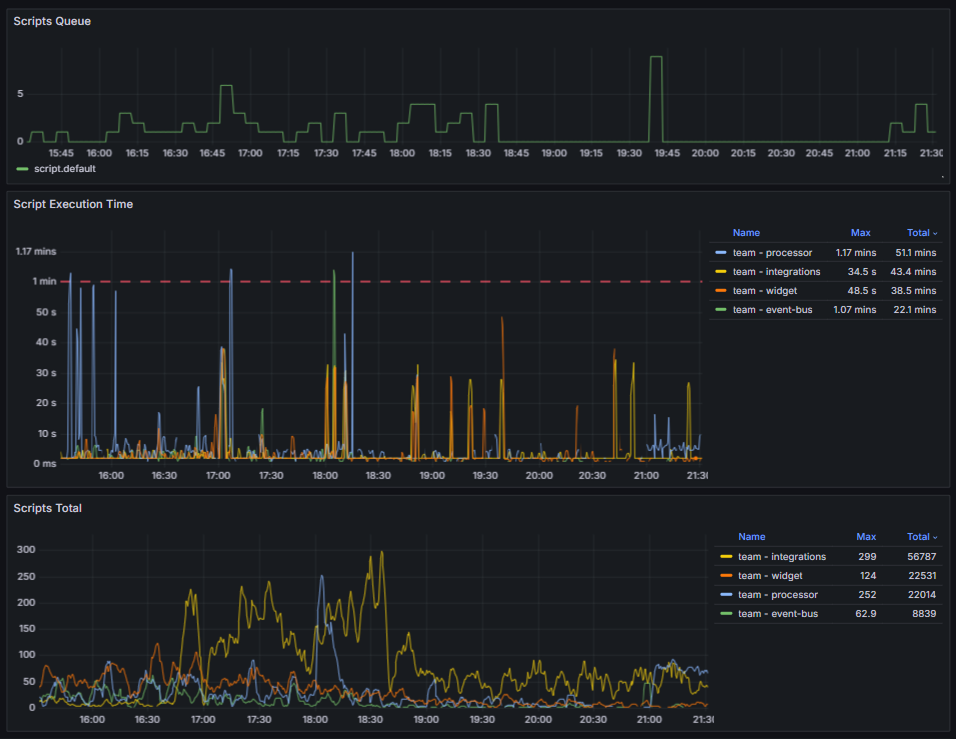
You can monitor the queue, execution time, and total number of scripts. Pay attention to general trends and sharp increases in the graphs. Such spikes may indicate that more scripts are being executed than usual or that their execution time has increased. If the queue is full, check the availability of dependent services and the database. If script execution time is constantly increasing, optimize them.
BRIX365 – Telemetry workspace
The charts in this workspace will show you the performance of the custom scripts:
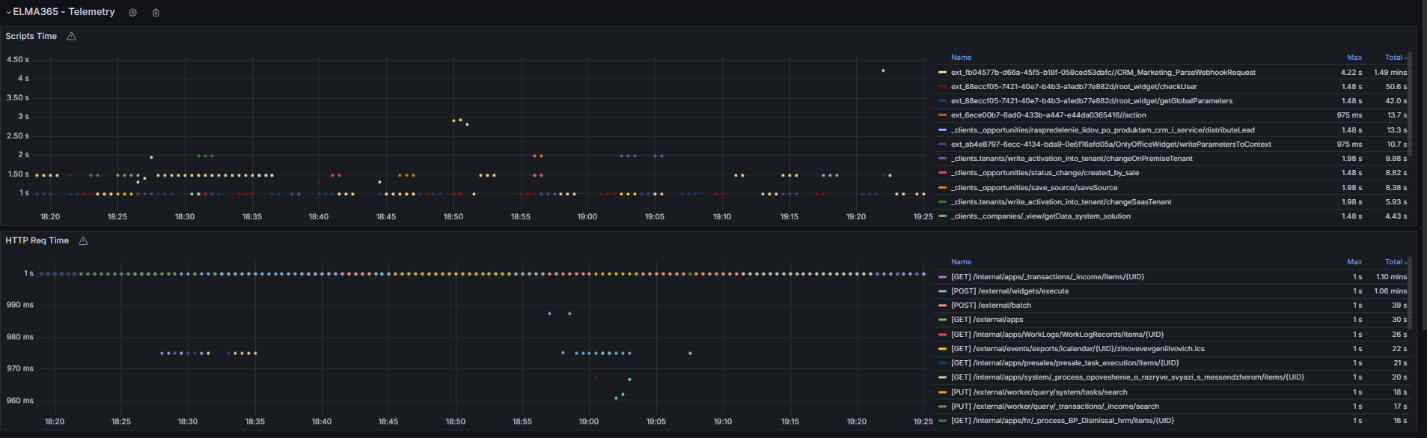
- The Script Time graph shows the execution time of scripts, which depends on their logic and the operations they perform. Define a baseline for typical scripts and analyze their performance. Signs of performance degradation include:
- A sustained increase in script execution time by 30‑50% relative to the standard value.
- Execution time exceeding 3‑5 seconds for scripts with a typical request and simple logic.
Possible causes of problems include non-optimal algorithms, data growth, and blocking.
- The HTTP Req Time graph shows the execution time of HTTP requests. If you observe a steady increase in errors, review the Loki logs.
Kubernetes Cluster
Here you can evaluate the overall condition of the cluster management components. These are essential for the operation of all applications, including BRIX. Problems at this level can lead to cascading failures.
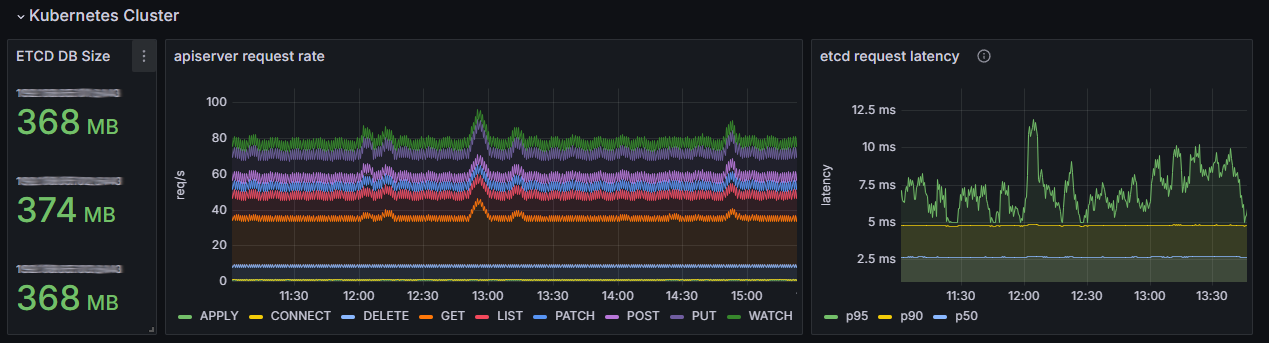
The graphs display the following data:
- ETCD DB Size. The size of the etcd database. A stable value with smooth growth, corresponding to cluster activity, is normal. For medium-sized clusters, the typical size ranges from hundreds of MB to several GB.
Indications of potential problems:
- Steady approach to the limit. By default, this is 2 GB, but you can set a different value.
- Sharp and unexplained increase in data volume.
Important: If the etcd database becomes more than 90% full, it may go into read-only mode. This blocks write operations in the cluster — no objects can be created or updated.
- apiserver request rate. The number of requests to the Kubernetes server API. A normal increase in the number of LIST and GET requests is proportional to the increase in the number of pods, services, or requests from monitoring tools such as Prometheus.
A sharp drop in the number of requests or a steady increase in the number indicate potential problems. - etcd request latency. The speed at which requests are processed on the etcd side. Normally, request latency should be stable and low. For the wal_fsync p95 operation (95th percentile) on a healthy SSD/NVMe drive, the latency is typically less than 15 ms, and p50 is less than 5 ms.
Values greater than 100‑500 ms for p95 and greater than 20 ms for p50 are abnormal. This may be due to insufficient disk speed which leads to latency across the entire cluster.
How to find sources of load on etcd
To stabilize the etcd storage, identify the components that are creating abnormal load on etcd and optimize their operation. To do this:
- If your etcd settings allow you to view a list of all keys, get them using the command:
etcdctl get --prefix / --keys-only
Analyzing the resulting list helps identify the predominant key types. These can be used to determine which component is causing the increased load.
- Analyze the apiserver_request_total metrics which are available in the Grafana monitoring system. High requests to certain components can help identify potential sources of load. This load is often caused by excessive activity of Prometheus, operators and controllers, as well as repeated kubelet restarts.
Pods info workspace
Monitor the status of your BRIX application pods using these graphs:
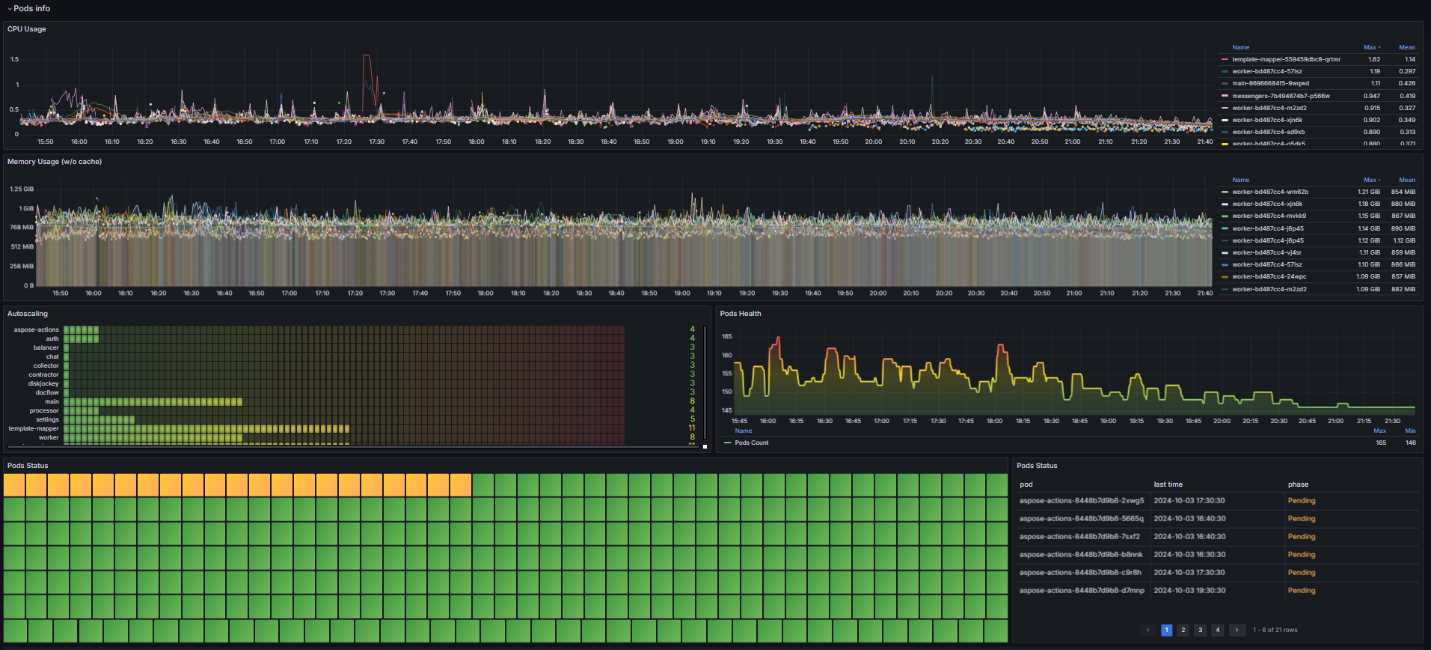
- CPU and Memory Usage. Shows how much CPU and RAM resources are used by pods. Consumption depends on the limits set.
- Pod Status. The number of pod restarts over a specified period. Zero or single restarts are normal. A steadily increasing number of restarts for a single pod indicates a problem within the container, such as an error termination or a failed liveness probe.
- Autoscaling. The number of service replicas. A sharp increase in the graph may indicate a resource shortage or service overload. In this case, increase the resource capacity and the number of replicas, as well as the pod limits. Then, review the service logs to identify possible sources of problems and troubleshoot them.
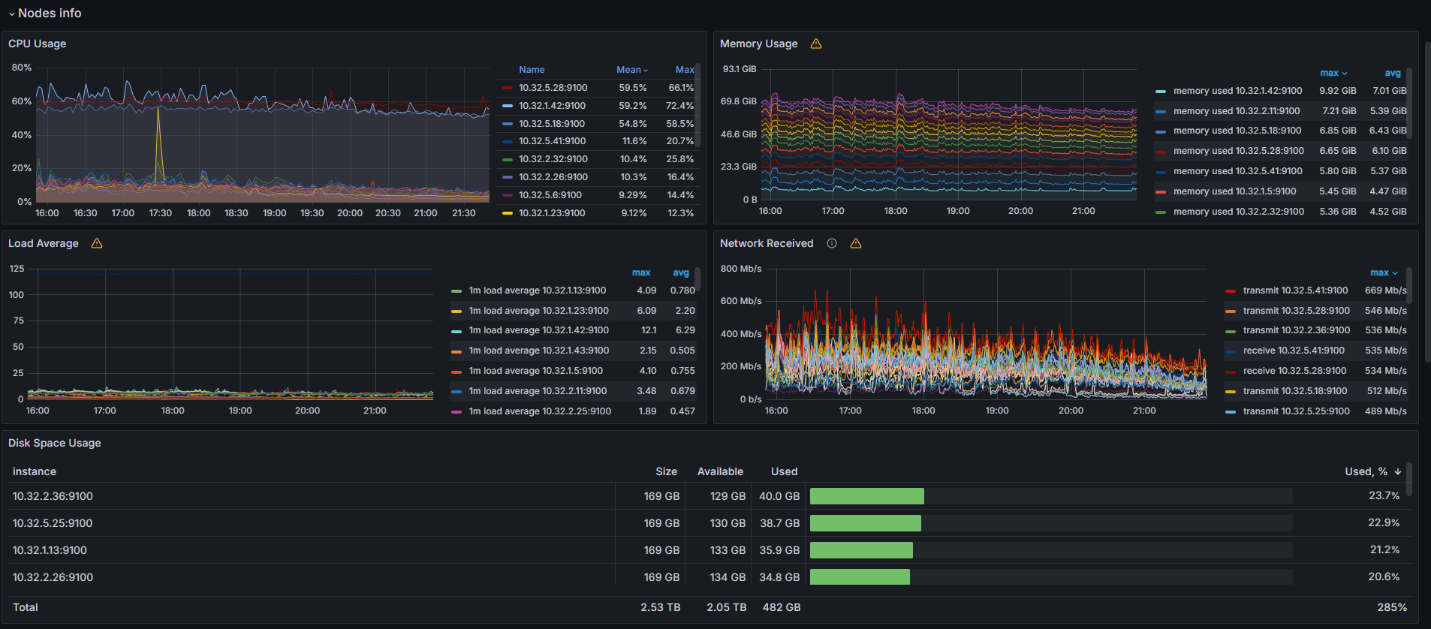
Nodes info workspace
This workspace provides information about the cluster status, including charts showing CPU and memory consumption, average load, network traffic, and available disk space on nodes. Based on this data, you can identify abnormal behavior and take corrective action.
If the load is consistently high (CPU utilization greater than 70%, memory usage greater than 80%), add additional nodes. The recommended configuration is from 8 CPUs and 16 GB of RAM.
If you have deployed a standard Kubernetes cluster, install a high-load Linux system to ensure optimal cluster performance.
The following workspaces provide information about database health monitoring: Postgres, RabbitMQ, MongoDB, and Valkey or Redis.
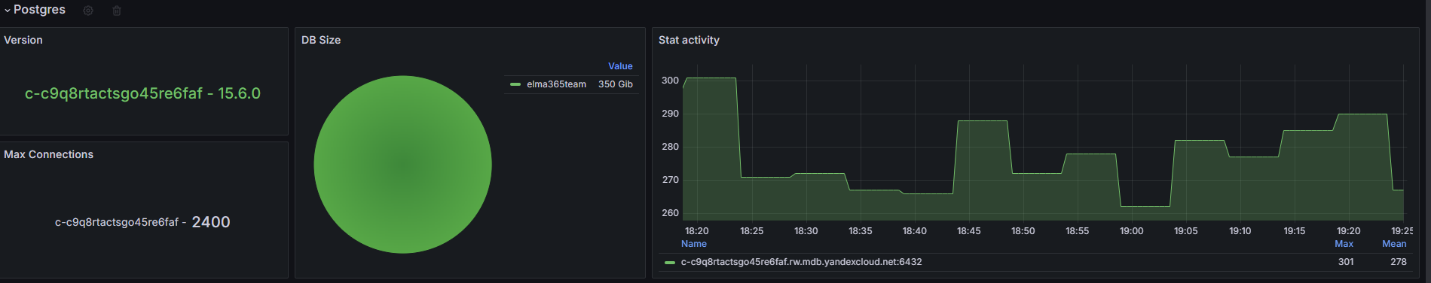
Postgres workspace
The most important chart in this workspace is Stat activity. It shows information about the current activity. If the chart value is close to the maximum (Max Connections), increase the max_connections parameter and analyze the connection pools in applications.
In the DB Size section, you can monitor how much free space is available in the storage. A disk full of no more than 85% is considered normal. A critical value is 90%. To ensure proper database operation, clean up unnecessary and obsolete records or increase the storage size.
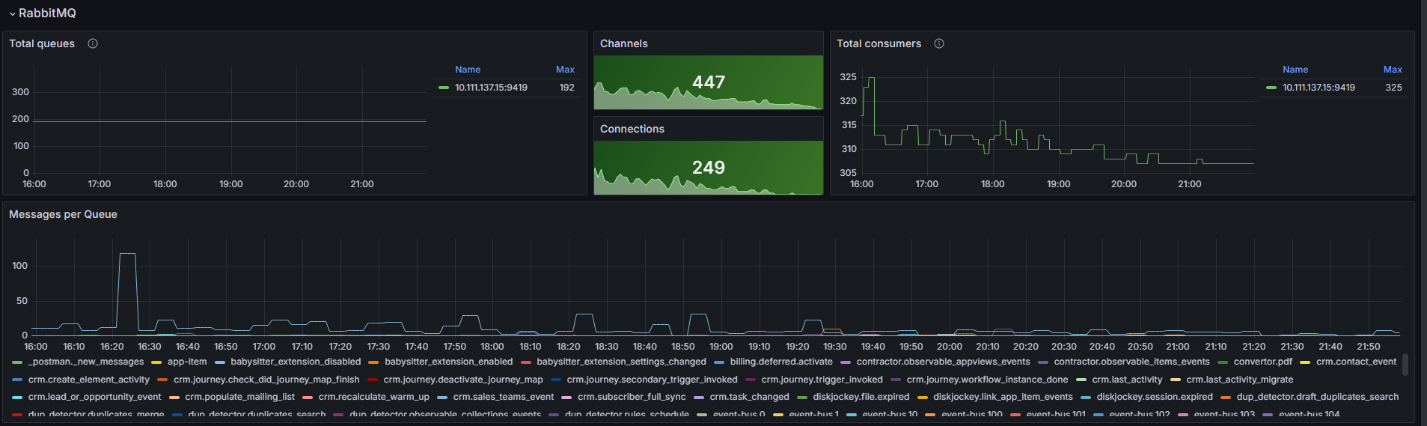
RabbitMQ workspace
The Messages per Queue chart shows the messages in the queue. You can use it to determine which microservice is accumulating messages. If the number of messages does not decrease or steadily grows, reboot the corresponding microservice and examine the service logs using Loki.
MongoDB workspace
In the charts in this workspace, you can observe open connections, memory load, and query operations.
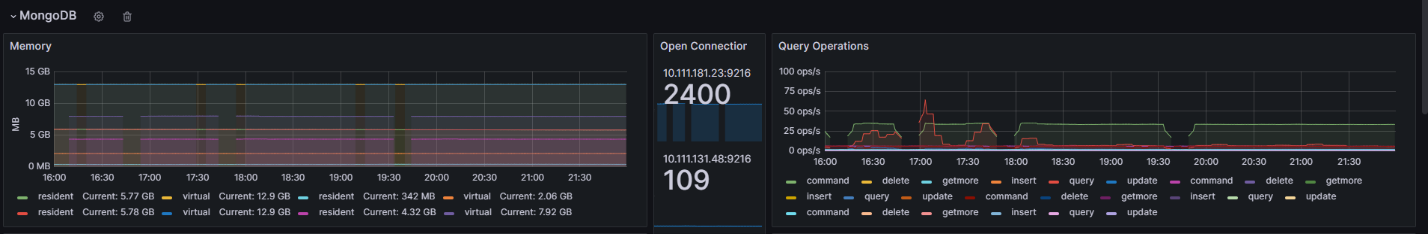
The Query Operations graph displays how many operations per second are executed in the MongoDB database. These metrics allow you to monitor performance and storage efficiency. Normally, the response time to incoming queries should remain stable. If the load level remains constant but query execution times increase, optimize your queries or add indexes to the database.
In the Connection Count section, you can view the number of active connections to the database. Compare the current number of connections with the maximum value set in the max_connections parameter. If you see that the graph is approaching the set limit:
- Change the max_connections parameter to a higher value.
- Analyze the services connecting to the database. Ensure that excess connections are not being created and that unused connections are closed promptly.
Cache workspace
Here you can monitor the performance of your data caching server. Metrics for the service used in your configuration are displayed: Valkey or Redis. The graphs show:
- CPU, Memory. Memory consumption. Approaching the maxmemory value leads to key eviction — the automatic deletion of some data to free up resources.
If the maximum memory is reached once, restart your data caching server. If this doesn't help and memory consumption remains close to the maximum, increase the memory.
If resource consumption is high, also analyze your custom code for incorrect caching. Ensure that the cache does not contain large JSON files.
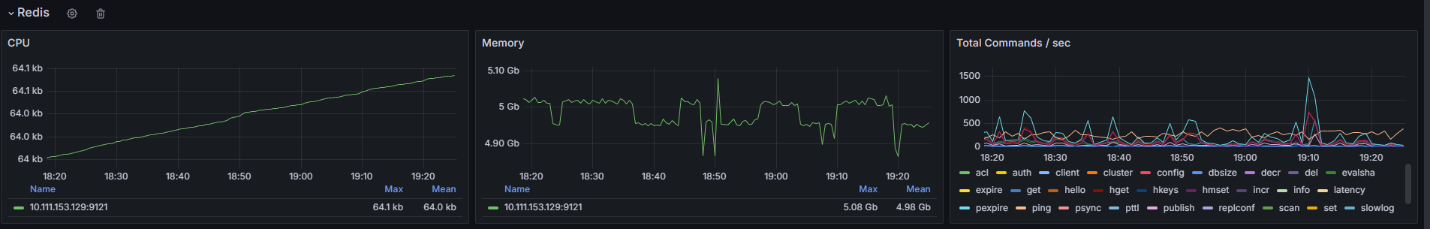
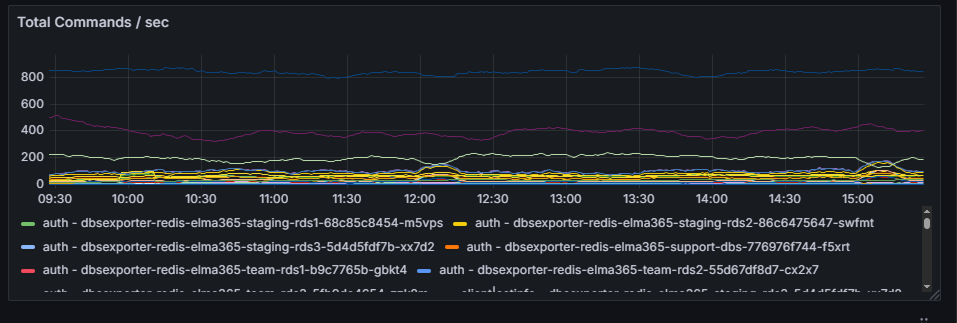
- Total Commands / sec. Displays the total number of commands per second processed in Redis or Valkey. This graph is used to monitor cache performance and efficiency. It also allows you to analyze various metrics related to command execution in Redis or Valkey.
Ingress workspace
Here you can find information about:
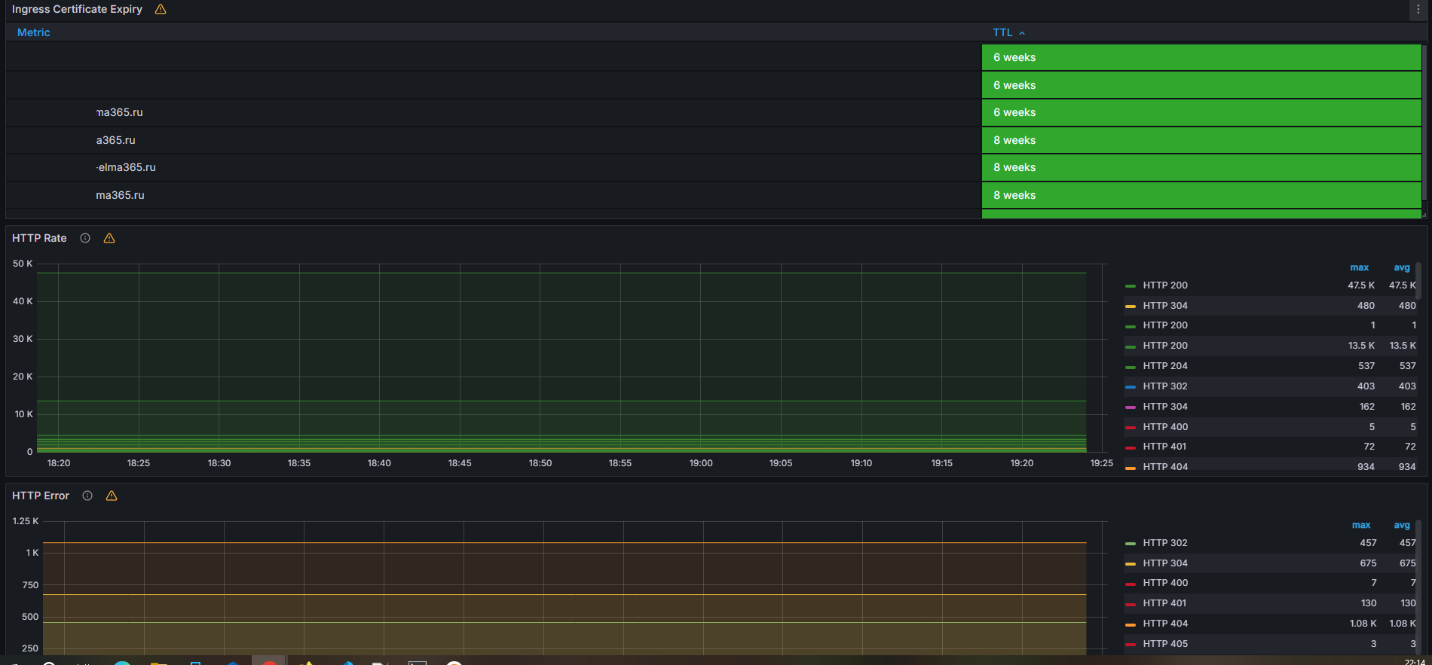
- Ingress Certificate Expiry. The remaining validity period of certificates. A value of less than 10 days is considered critical.
- HTTP Rate. The number of HTTP requests passing through the Ingress.
- HTTP Error. If the number of errors in this graph increases, examine the Ingress Nginx logs to identify the cause.
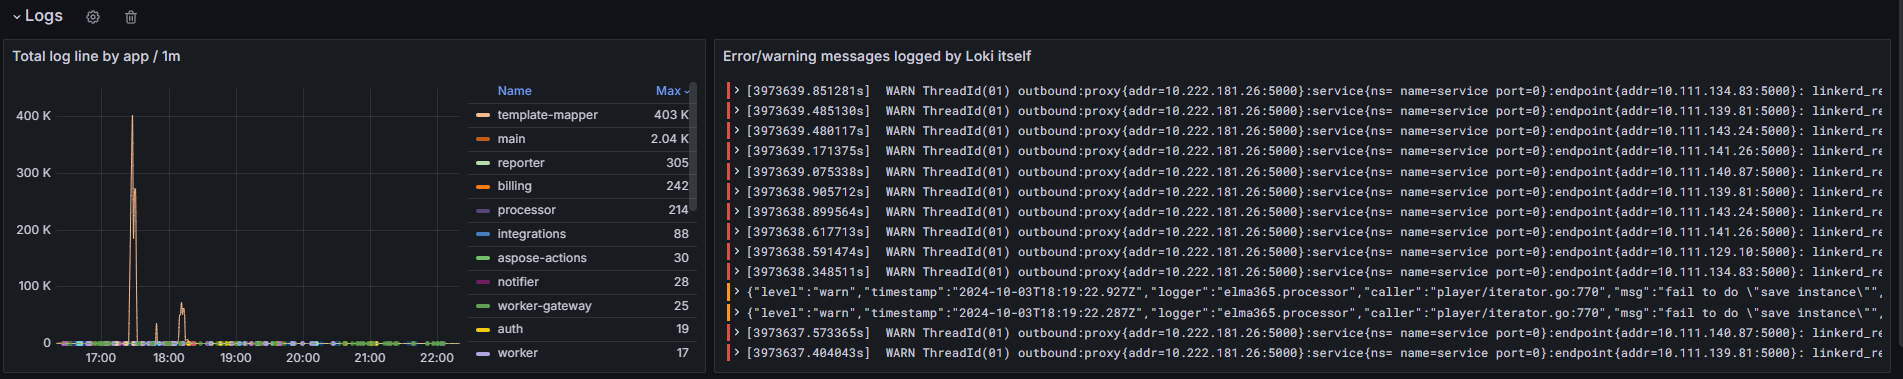
Logs workspace
This workspace is used to quickly analyze logs. Here you can identify the service with the highest number of errors for a given period and examine the logs that that logged using Loki.
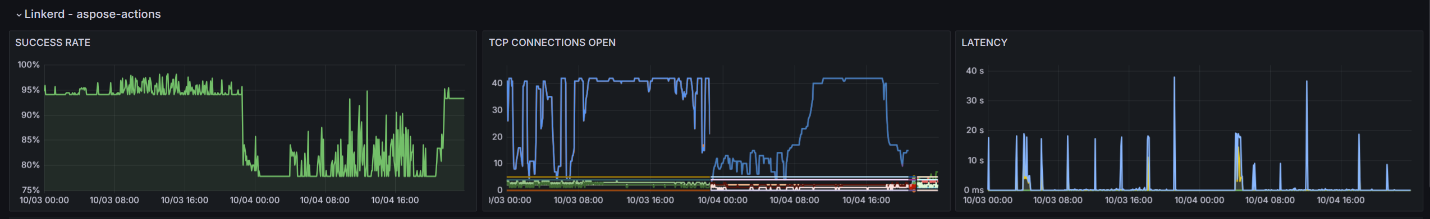
Linkerd workspace
If the Linkerd service is installed, this workspace allows you to monitor the status of mesh connections for a particular deployment. It is important to monitor the SUCCESS RATE graph. It displays the number of successful requests between services. If problems arise, the number of such connections will decrease. For most services, a value close to 100% is normal. Watch out for a drop in the success rate below 95% for key services or below 80% for any service. In this case, analyze Linkerd operation, including checking the internal certificate and analyzing the service logs.
The chart below shows the moment of performance degradation. The following warning occurred: level=warning msg=“unable to parse quantity’s suffix (config.linkerd.io/proxy-memory-limit)”. In this case, check the Linkerd configuration file and correct the errors in the requests and limits parameters.
Kubernetes Events – Stats workspace
The charts can be used to track various events in the cluster and provide information about the status of the pods.
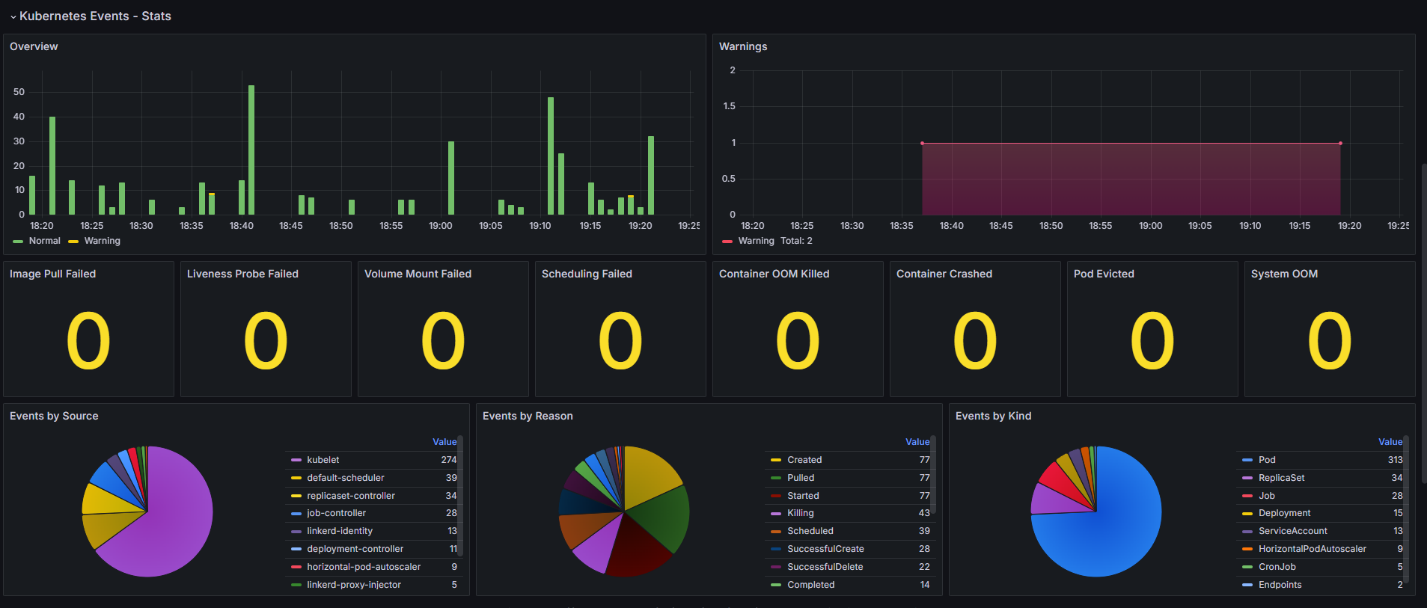
Containers:
- Image Pull Failed. It is impossible to download a container image to run the pod, for example, if the container register is unavailable or the requested image is missing.
- Liveness Probe Failed. This event occurs if communication between the pod and the liveness probe, which is used to check the correctness of the pod operation, is broken.
- Volume Mount Failed. Persistent volume or storage resource cannot be mounted. This behavior can occur if the storage is misconfigured or if there are network or permissions issues.
- Container OOM Killed. The pod has terminated due to insufficient memory. This event occurs if the pod is consuming too much memory and the node cannot provide the required resources.
- Container Crashed. The cause can be an error inside the container or its incorrect operation.
- Pod Evicted. The pod has been removed due to a lack of memory or CPU. The event occurs if a node is overloaded or the pod consumes a large number of resources.
Scheduling events:
- Scheduling Failed. This event occurs when the Kubernetes scheduler is unable to place a pod on a node due to a lack of resources or other constraints.
System events:
- System OOM. This event is logged when there is insufficient memory at the system level, such as due to a high load on a node or insufficient system resources.