This article covers the installation of Kubernetes Event Exporter. This add-on is used for monitoring events within a Kubernetes cluster.
Before using the add-on, first install Loki.
The installation of the add-on consists of three steps:
- Download the Helm chart and configuration file..
- Fill out the configuration file.
- Install the kubernetes-event-exporter chart using helm in the Kubernetes cluster.
Step 1: Download the Helm chart and configuration file.
To install via the internet, obtain the configuration file values-kubernetes-event-exporter.yaml by executing the following command:
helm repo add elma365 https://charts.elma365.tech
helm repo update
helm show values elma365/kubernetes-event-exporter > values-kubernetes-event-exporter.yaml
Obtaining the configuration file for installation in an closed environment without internet access
helm repo add elma365 https://charts.elma365.tech
tar -xf kubernetes-event-exporter-X.Y.Z.tgz |
Step 2: Fill out the configuration file
|
kubernetes-event-exporter: Where the format of |
Step 3: Install the kubernetes-event-exporter chart using helm in the Kubernetes cluster
Install the kubernetes-event-exporter chart to namespace monitoring.
For installation via the internet, use the following command:
helm upgrade --install -n monitoring kubernetes-event-exporter elma365/kubernetes-event-exporter -f values-kubernetes-event-exporter.yaml
For offline installation without internet access, navigate to the directory with the downloaded chart and execute the command:
helm upgrade --install kubernetes-event-exporter ./kubernetes-event-exporter -f values-kubernetes-event-exporter.yaml -n monitoring
Data visualization
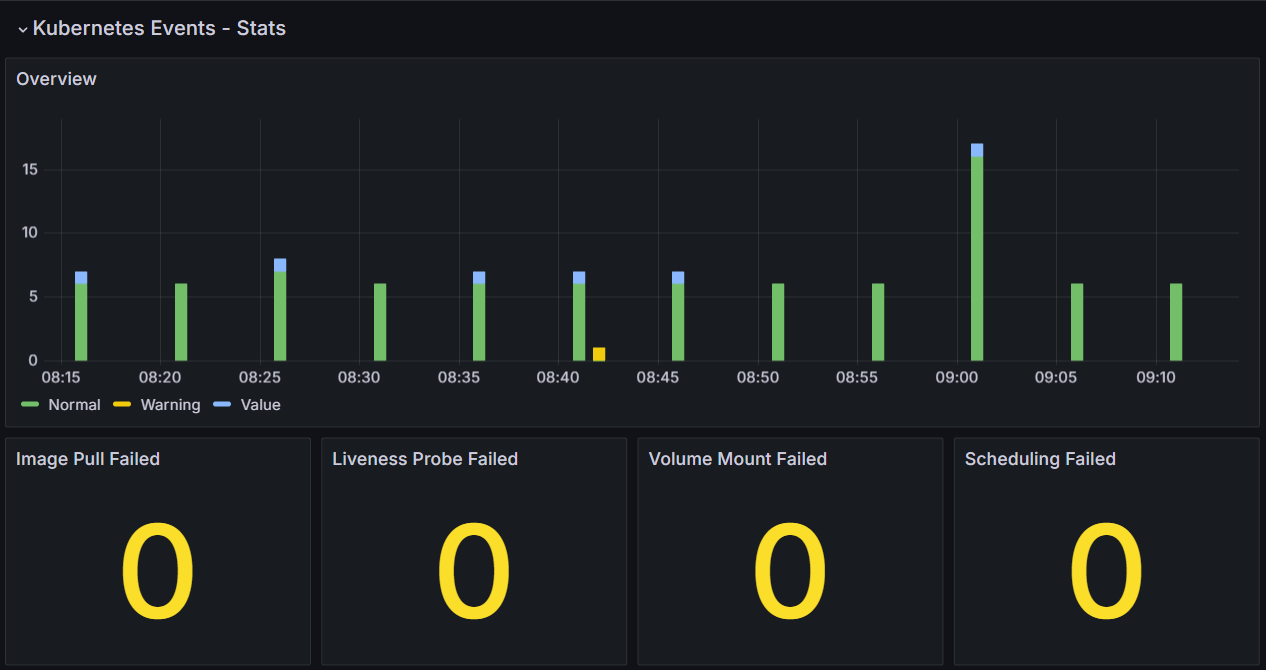
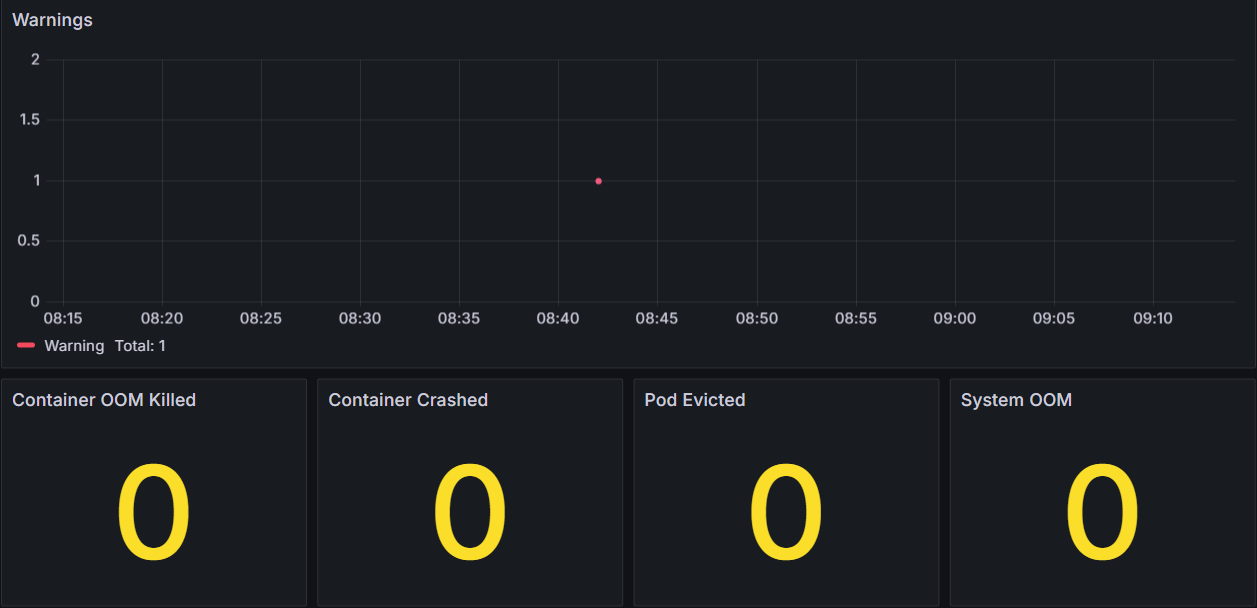
In the Grafana data visualization software system, you can view the charts of Kubernetes Event Exporter:
- Chart example 1:

- Chart example 2:

Found a typo? Select it and press Ctrl+Enter to send us feedback