Process Monitor is an analytical tool for system administrators that helps to track processes in real time.
Using the process monitor, you can:
- View the process statistics: how many instances are running, have been completed or interrupted, what task is currently being performed, and who is the executor.
- View the list of current operations and their executors, a map, and the start and end dates of the activity for a specific instance.
- Bulk update the version for already running instances after publishing a new version of the process.
- Interrupt the execution of one or more instances if errors are detected in their process.
- Archive old instances to optimize system performance. This option is available after enabling process instance archiving.
начало внимание
Only users included in the Administrators group have access to the process monitor.
конец внимание
To go to the monitor page, go to Administration > Process Monitor.
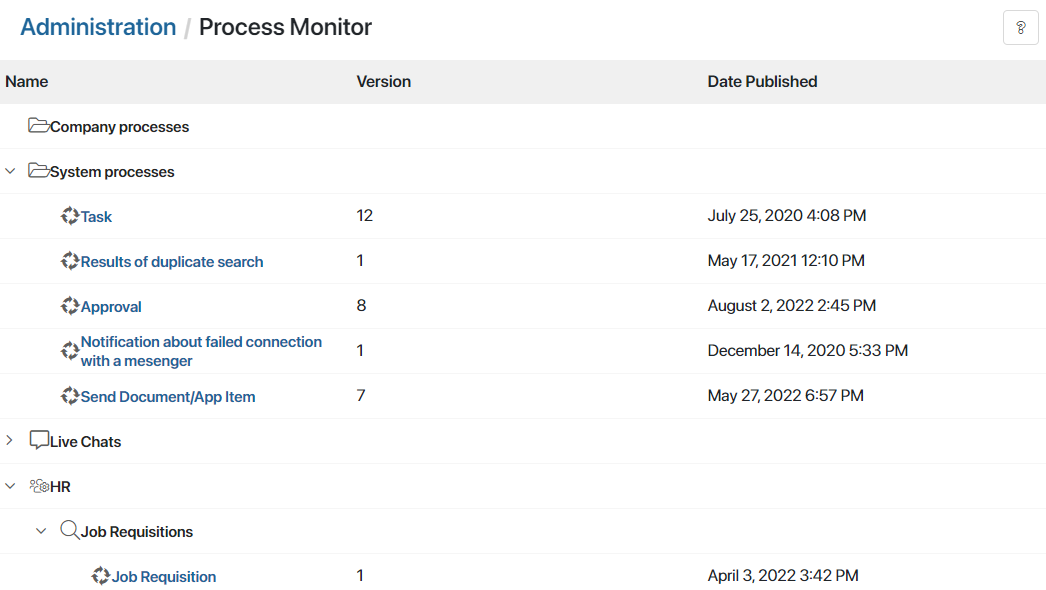
The monitor allows you to track the following business processes:
- System, i.e., default processes of the platform and system solutions used.
- Imported as part of workspaces, modules, and solutions, including business solutions from the BRIX Store. The exception is the processes of modules included in a paid solution, as they are not available on the monitor page.
- Created by users at the level of the company, workspaces, apps, and custom modules.
To find a process, enter the process name in the search bar or use search by parameters or conditions.
If you are using an On‑Premises version earlier than 2026.1, the search bar will appear after enabling the enableSearchInProcessMonitor feature flag. For more information, see Modify BRIX parameters.
Customize the process monitor page
You can customize the layout of the process tree. To do this, use the options in the upper right corner of the page:
- Expand All. Open all folders, including nested folders.
- Click
 to proceed to the following actions:
- Show workspaces in a separate folder. Combine processes across all workspaces in the Workspaces folder.
- Expand the tree when searching. This option is enabled by default. The results of the process search will be displayed in the expanded folders. In the On-Premises edition, the option is available if the search bar display flag is enabled.
- Sort in alphabetical order. This option applies to the list of nested folders and the list of processes in them.
- Hide empty folders. Hide folders, workspaces, apps, and modules that do not contain processes.
- Other processes. Display the folder with business processes associated with the apps and workspaces deleted from the system.
Process page
To see detailed information about instances, executors, tasks, etc., open the process page by clicking on its name in the list. The data on the page is grouped into three sections:
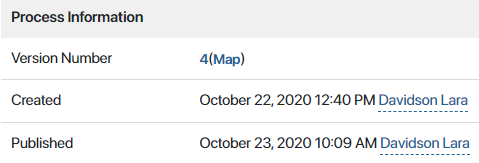
Here you will find the version history, the map, the date when the process was created and the date when the latest version was published. By clicking on the number, you can see the comments for each version.
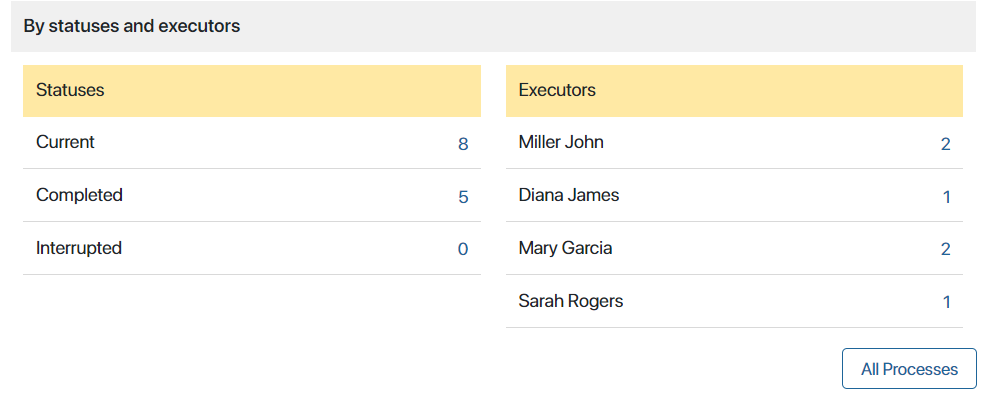
This section provides information about the status of all instances that have ever been run. The left column shows how many instances are currently running, and how many have been completed or interrupted.
By clicking on the counter to the right of the status, you can filter the information in the table below so that only current, completed, or interrupted instances are displayed. To reset filtering, click All Processes.
In the Executors column, you will see a list of process participants with tasks. Click on the task counter to see all the tasks assigned to this employee in all instances of the process.
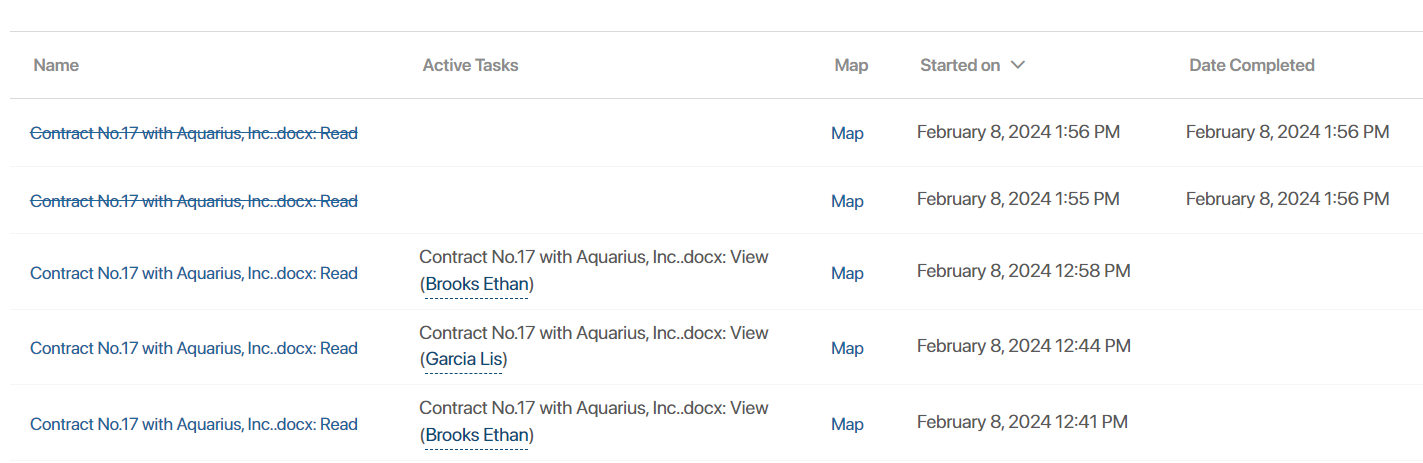
The item names are highlighted in color depending on the status of the process instance:
- Blue. Active instances.
- Yellow. Active instances with problems, such as a long-running automated action. Find out which step the process is stuck on and optimize the activity settings.
- Gray. Interrupted instances.
- Red. Instances with an error, as well as overdue tasks.
The names of completed and interrupted processes are crossed out.
Instances in the table can be sorted by name, start date, and completion date. To do this, click on the name of the column. To reverse the sort order, click on the arrows next to the name.
To find the desired process instance, use the search function at the top of the Process Monitor page.
When you click on the name of an instance, its page opens. It contains all the necessary information: a list of tasks, deadlines, executors, context variables, the process map, as well as links to running child and parent processes. You can read more about the process page in Process instance page.
In the table, you can also perform bulk actions with the instances, such as update process version or interrupt the instance running. You can track their progress on the Bulk operations page.
Update process version in running instances
After publishing a new process version, you can update already running instances so that they continue with the latest changes. To do this:
- In the list of process instances, check the instances for which you want to update the version. You can select all instances on the page or all instances that have ever run by checking the box next to the Name column and selecting the desired option.
- To the right above the table, click the Update Version button.
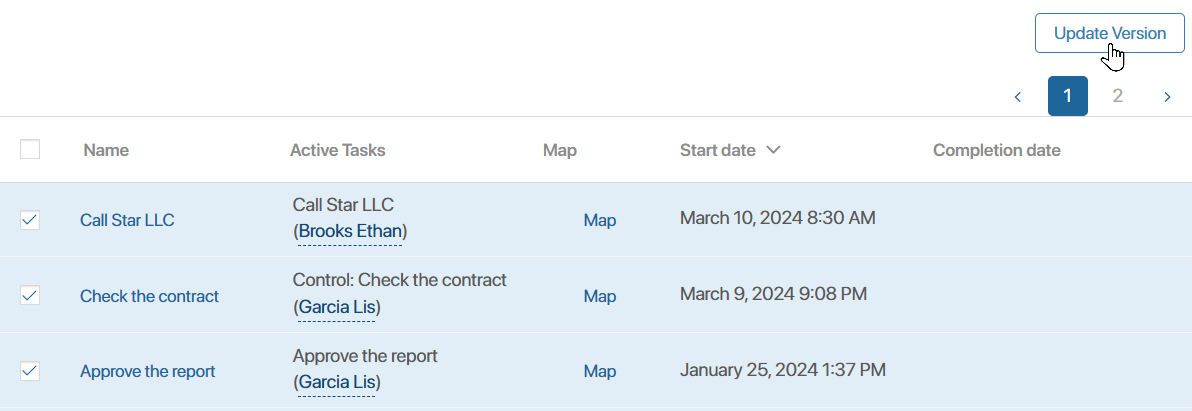
- The bulk operation page will open. There, you can:
- Immediately update the instances versions by clicking the Start button.
- Perform the action later on the Bulk operations page. To do this, close the page.
After the update, the latest changes will be made to the instance map and the process will continue according to the current flowchart.
Interrupt an instance
If a process is incorrectly configured, you can interrupt its running instances. To do this:
- Go to the instance page and click Interrupt Process.
- In the table with the list of instances, select the required items and click the Interrupt button. A bulk operation page will open. On this page, you can:
- Immediately interrupt running instances by clicking the Start button.
- Perform the action later on the Bulk operations page. To do this, close the page.
All participants of the interrupted process instance will be notified about it in #Activity stream.
If interruption rules interruption rules are configured for a process and it has a parent or child processes, their instances will also be terminated.
Archive instances
If process instance archiving is enabled in your company, you can manually archive interrupted or completed instances using one of the following methods:
- In the list of process instances, select the ones you want to archive and click the Archive button on the right above the table. A bulk operation page will open, where you can:
- Archive instances immediately by clicking the Run button.
- Perform the action later on the Bulk Operations page. To do this, close the page.
- Go to the instance page and click the Archive button.
In the instance page, the status will change to Archive, and an Unarchive button will appear to restore them from the archive. A record of the operation will appear in the Administration > Archiving of Process Instances on the History tab.
Delete instances
On the Process Monitor page, from the list of instances, you can delete those that are in the Interrupted or Completed status. To do this, open the page of the required instance and click Delete Permanently. The closed tasks created within this instance will also be removed from the Tasks workspace.
For more details, see Delete a process instance.