In Administration > Error Monitor, you can track process instances where an error occurred during the execution of server scripts, block settings, etc. The monitor does not include issues with client‑side script execution, as the process instance does not enter an error state in such cases.
начало внимание
Only users included in the Administrators group have access to the Error Monitor.
конец внимание
The main information about the errors is displayed as a table. You can see the process name and version, the workspace and app in which the process was created, as well as the start date and the author.
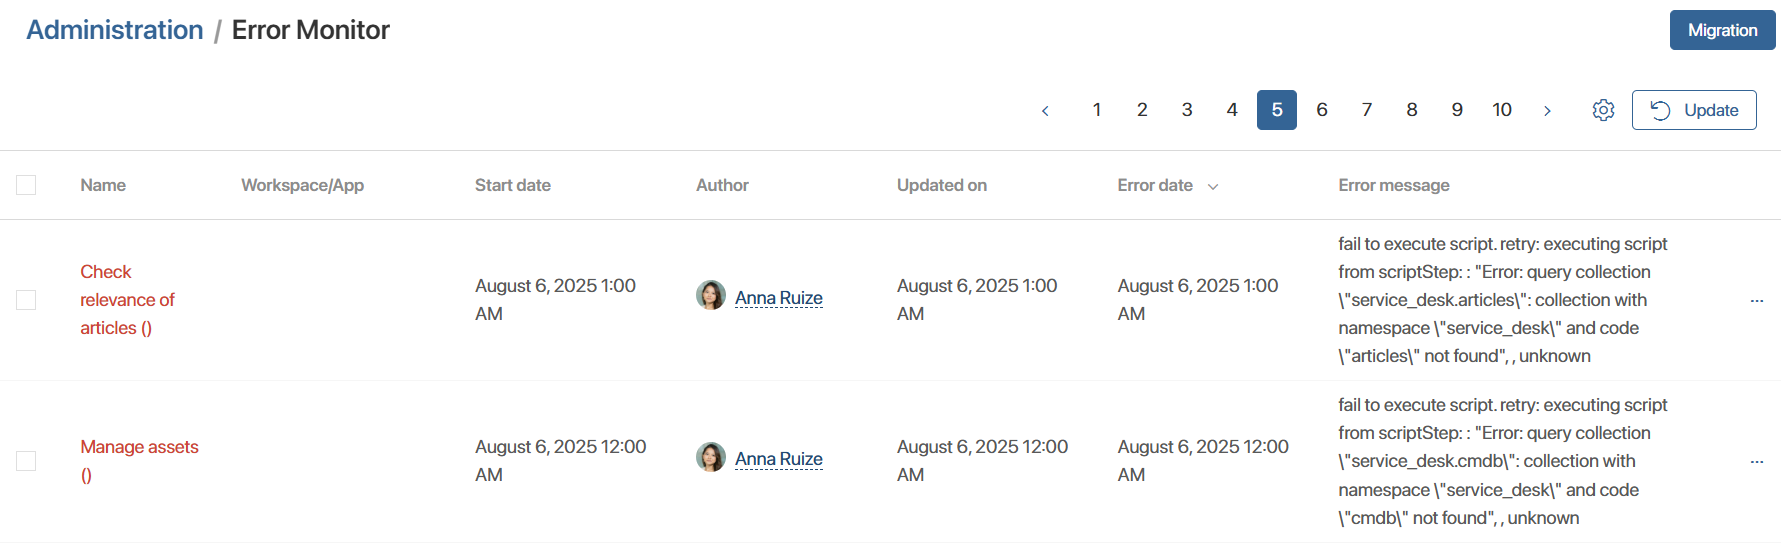
You can view the process step where the error occurred. To do it, click the instance name in the table. On the opened page, go to the History tab. The failed activity is highlighted in red text. On the process map, the activity is outlined in red.
Also, you can:
- Search for process instances by their parameters using the search bar.
- Customize the table layout.
- Sort instances by any column.
Начало примечание
For BRIX On‑Premises below 2026.1 the updated error monitor is enabled via the enableUpdatedErrorListMonitor feature flag. For more information, refer to Modify BRIX parameters.
In the monitor, only process instances with errors that occurred after the feature flag was enabled will be displayed. Run the monitor update process to add errors that were identified earlier to the page.
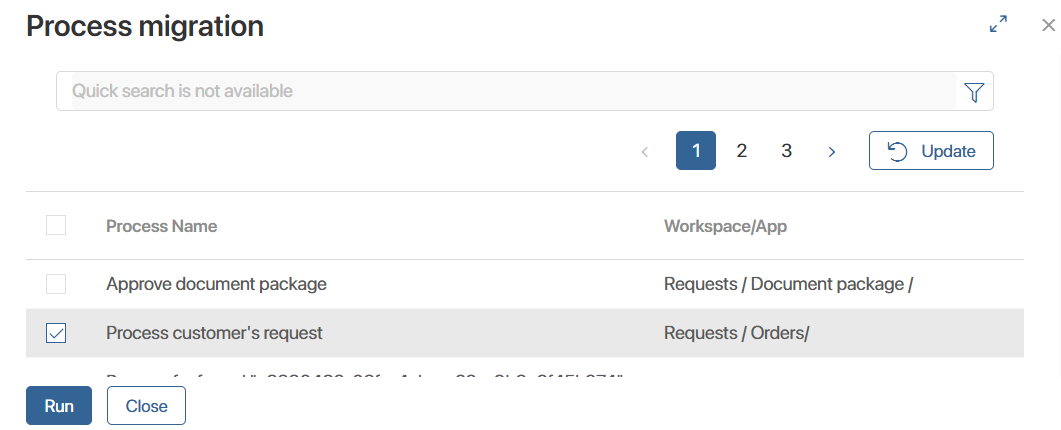
To update error monitor data after enabling the feature flag in system versions below 2026.1
To track the migration progress, click the Migration button again. In the window that opens, you can:
|
Конец примечание
Fix an error
To fix an error, click the ![]() icon to the right of the process name.
icon to the right of the process name.
The following actions are available in the menu:
- Restart. Execute the current step with the error one more time.
- Skip step. Skip the step with the error. The process will go to the next activity on the diagram.
- Update version. Apply the latest published version of the process to the active process instance.
- Interrupt process. Terminate the process execution. Please note that if interruption rules interruption rules are configured for a process and it has a parent or child processes, their instances will also be terminated.
You can also skip or restart the step with the error on the process instance page. To open it, click the instance name in the table.
In addition, you can apply one of the actions to more than one process instance at once. To do this:
- Select the process instances. To select records on the page or all current instances, check the box next to the Name column and select a necessary option.
- Click the Bulk Action button that appears above the table and select an option from the list. After that, the operation page will open. There, you can:
- Start the action immediately by clicking the Start button.
- Perform the action later on the Bulk Operations page. To do this, close the page.
Update data
To update the error monitor, click the Update button above the table.
If you want support staff to quickly solve issues with business processes, set up the automatic data update. To do this, select the Automatically option in the Update field above the table.
This field will not be displayed if the enableUpdatedErrorListMonitor feature flag is enabled. In this case, you can enable automatic data refresh in the table settings. Click the gear icon in the upper right corner of the page and select the Auto-refresh item list option.