The reports on this tab help identify the most profitable services and provide access to the database of contracts signed with clients and related requests.
Cost of Services
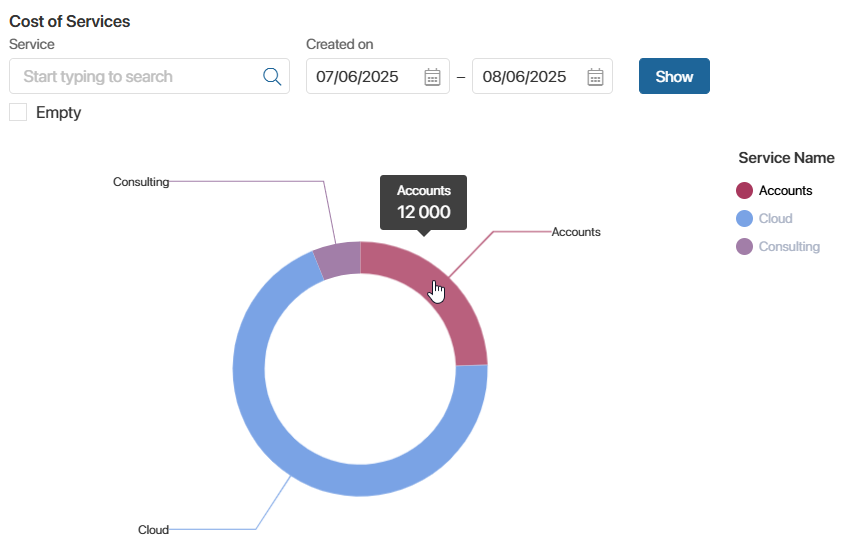
This pie chart shows the distribution of total service costs over a selected period.
The cost is defined in the price list, which can be created for each contract. The report sums up the service cost specified in all price lists.
Select dates to display services for which price lists were created during that period.
Hover over the chart to see the cost of a specific service.

Contracts
This table shows all signed contracts, the requests created under them, and the name of the client company.
The report helps you identify:
- Clients who frequently request services.
- The number of contracts signed with a specific client.
- How many requests a client submits under a contract.
This allows you to see which clients are most actively engaged.
You can filter records by contract name or client.
Click the name of a contract, request, or company to open its details.
Profitability of Services
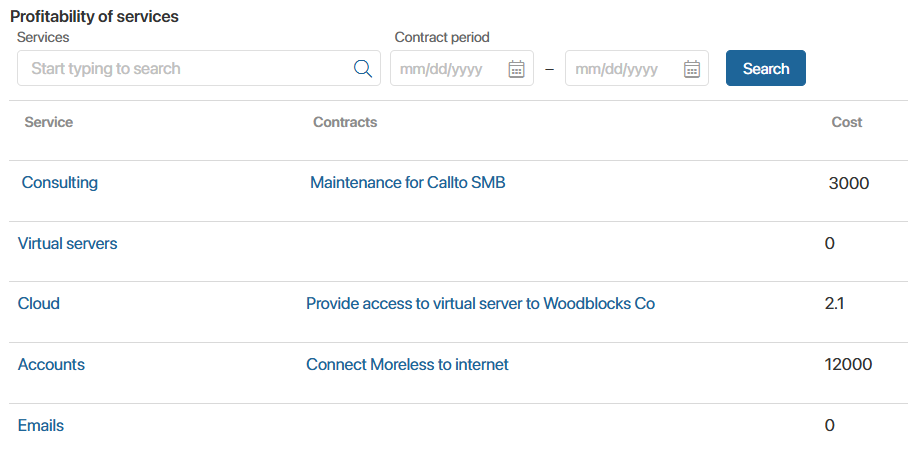
This table shows the total revenue from all contracts for each service. The report helps highlight the most profitable services.
For more accurate analysis, filter the data by service or contract start and end dates.

Click the name of a contract, request, or company to open its details.
Found a typo? Select it and press Ctrl+Enter to send us feedback