The page displays a report on the configuration item (CI) database, allowing you to track the following data:
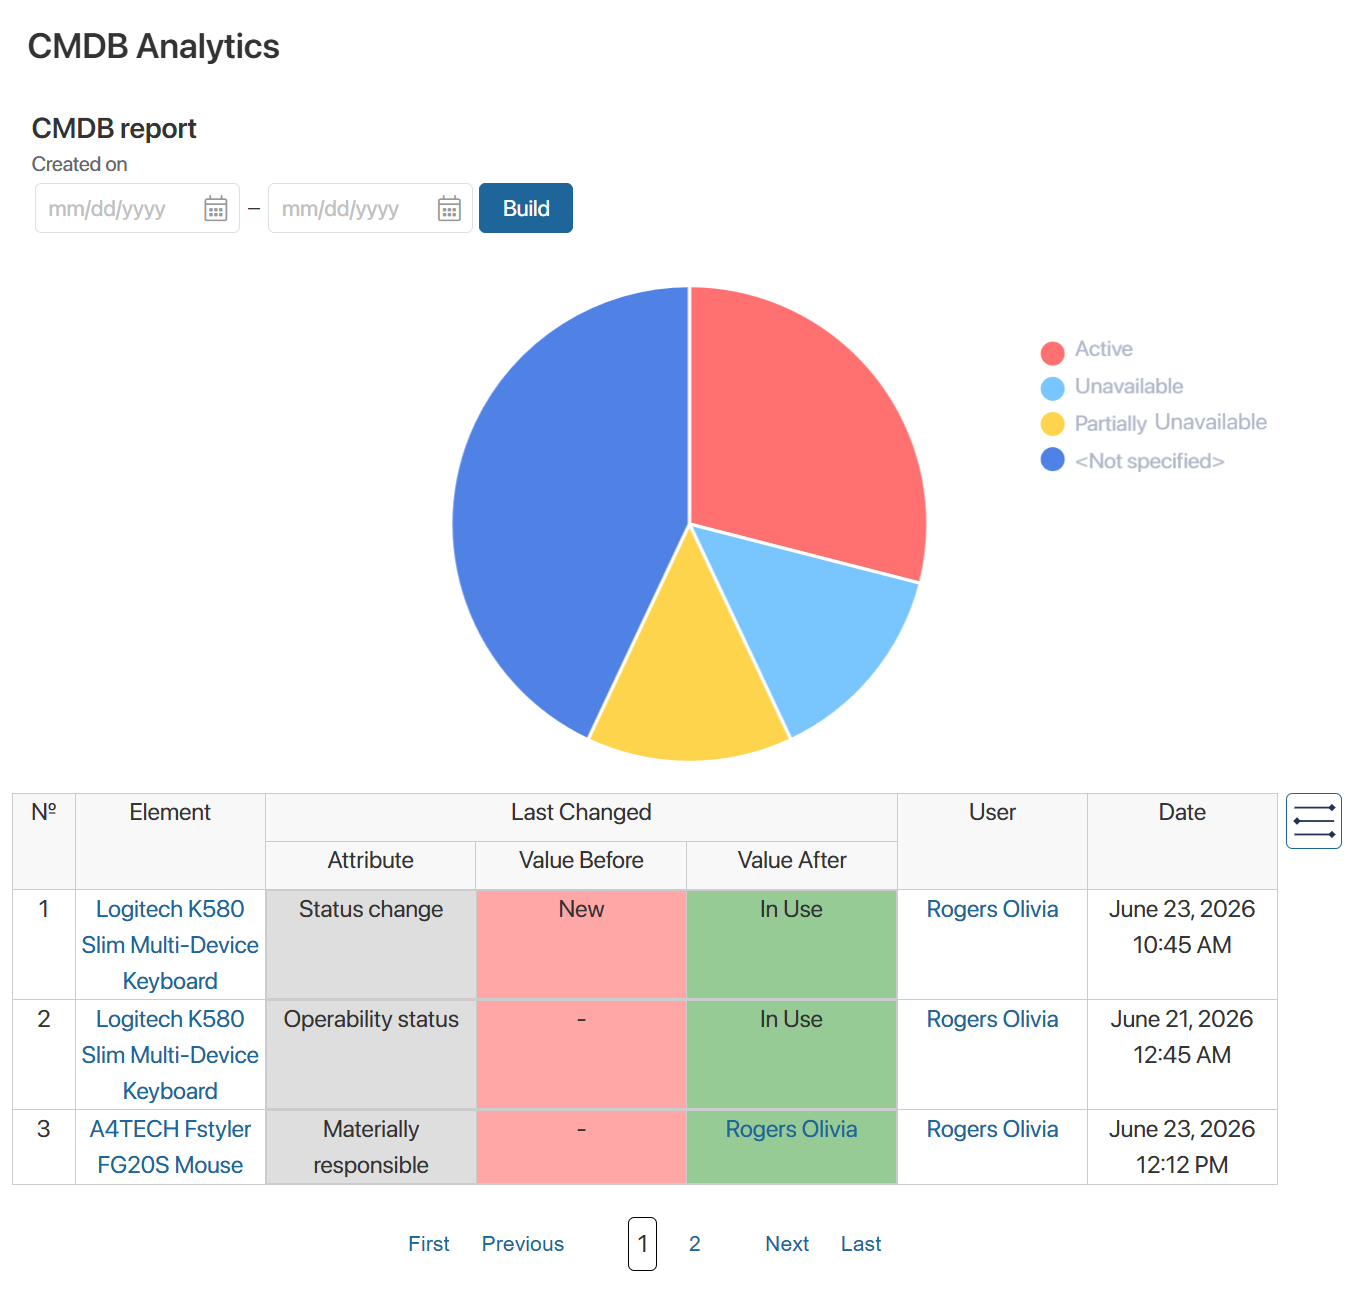
- Operability Status. The pie chart allows you to view the number of CIs with the following statuses: Partially Unavailable, Unavailable, and Active.
To generate the report, specify the period for creating equipment records and click the Build button. When you hover over the chart, its status and the number of records it contains will be displayed. - CI Change Log. The table records changes made to CI pages, such as status changes, field edits, and so on.
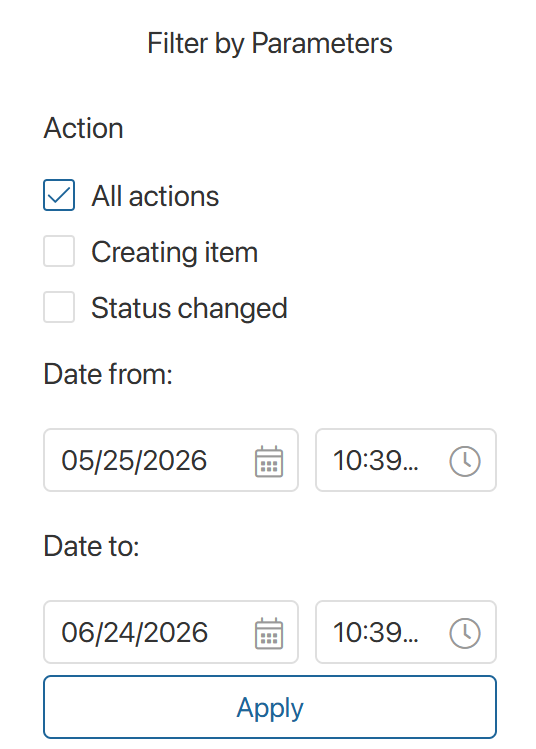
To filter the data, click the icon to the right of the table. In the dropdown window, select the actions and set the change dates. Click the Apply button.