The Live Chats Report widget is used to make reports in the Live Chats workspace. Using this widget, you can analyze the performance of your live chats: check the efficiency of operators and live chats, see the amount of incoming requests, etc.
Add the widget
To place the widget on a page, drag it from the right-side panel of the interface designer to the modeling canvas or click +Widget. Read more about adding widgets in the Add a widget to a page article.
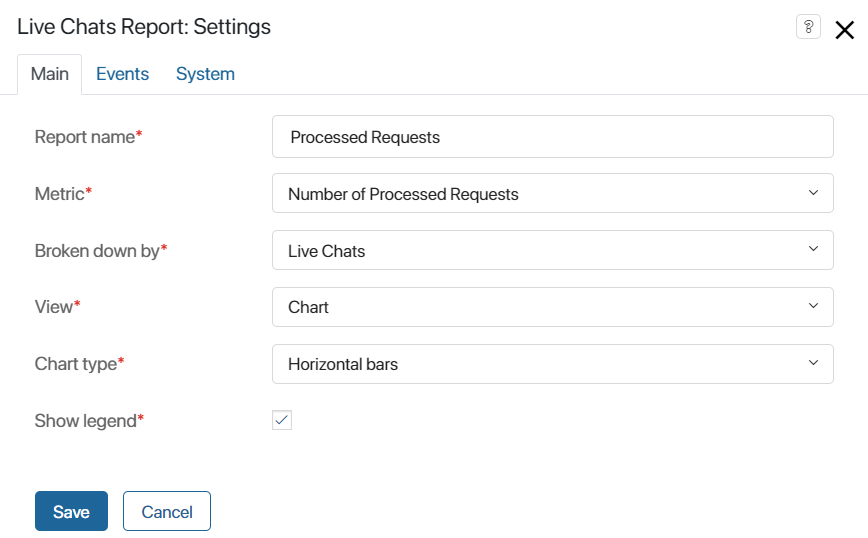
In the window that opens, configure the widget.
Main tab

- Report name*. Specify the name of the report. It will be shown in its title.
- Metric*. Select a metric that the report will be based on from the drop‑down list.
- Average Response Time. The average time it takes the live chat’s operators to respond to customers’ messages.
- Maximum Wait Time. The maximum time a customer has to wait in between the operator’s responses.
- Average First Response Time. The average time that passes between the moment a session is assigned to an operator and the moment the customer gets a reply.
- Percentage of Bot Responses. Percentage of responses in sessions that are sent by the bot.
- Average Session Duration. The average duration of a session before it is closed.
- Number of Processed Requests. The total number of requests received and processed in a live chat.
- Broken down by*. In the drop-down list, select the parameter that the data will be broken down by. Depending on the metric selected, the following options may be available: Operators, Operator Groups, Live Chats, and Entire Company.
- View*. Select the way the report will be displayed: as a table or as a chart.
- Chart type*. This field appears if you choose the Chart view. From the drop‑down list, select the chart type: vertical bars, horizontal bars, line chart, or pie chart.
- Show legend*. This field appears if you choose the Chart view. Check the box if you want the value selected in the Metric field to be displayed next to the live chart.
- Also group by*. This field appears if you choose the Table view, and the value of the Broken down by field is Operators or Operator Groups. Click the plus icon to add a field to the list of properties that will be used to group data in the table.
Events and System tabs
These tabs contain settings similar for all widgets. They allow you to set the widget’s visibility and access permissions, configure the widget’s behavior when the user hovers over it, etc. Read more about these settings in the System widget settings article.
To finish configuring the widget, click Save.
To make the page available to users, click Save and Publish on the interface designer toolbar.
Found a typo? Select it and press Ctrl+Enter to send us feedback