Using the reports on this tab, you can:
- View the total number of created requests and their distribution by type.
- See which services clients contact support about most often.
- Review the customer satisfaction index for service delivery.
- View statistics by request submission channels.
Requests
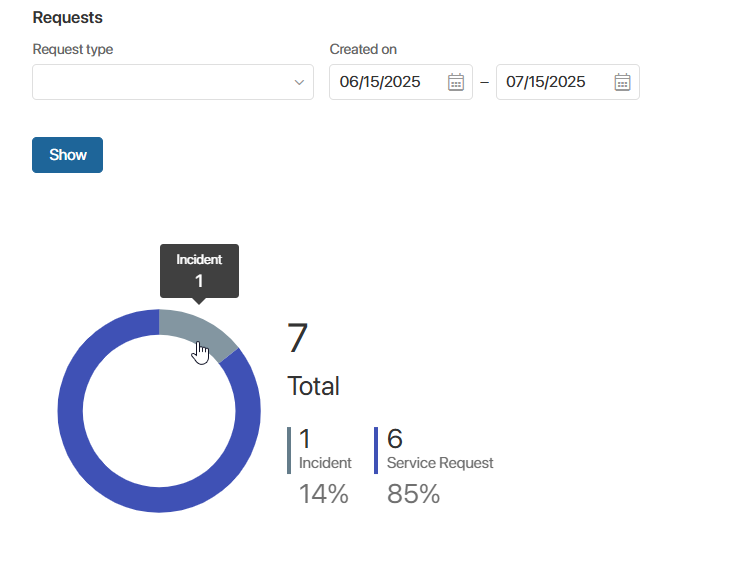
This report helps identify which types of requests are most frequently submitted by clients. A donut chart displays the total number of created requests and the share of each type.
Hover over the chart to see the number of requests for a specific type.

Services
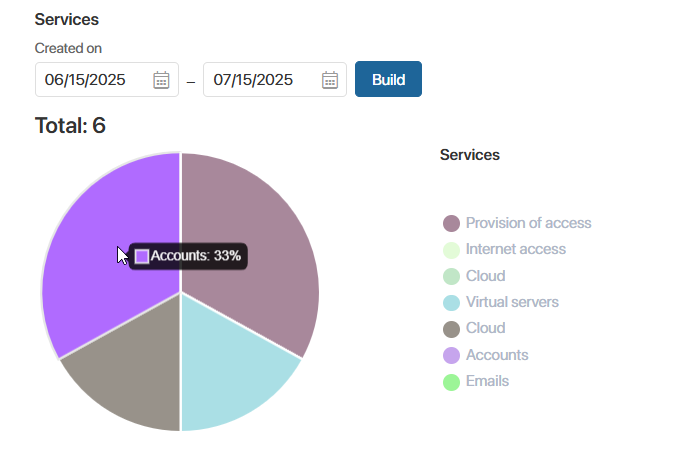
This report shows which services clients most frequently request support for.
The total number of requests received during the selected period is displayed, along with a pie chart showing the percentage distribution of requests by service.
Hover over a chart segment to see the service name and the number of associated requests.

The chart on the page uses the Requests Report widget.
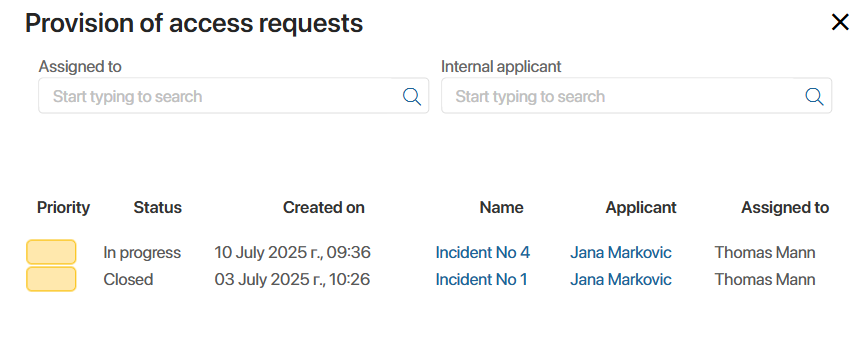
To view the list and details of the requests, click on a service in the chart.

Use the fields Responsible, External applicant, and Internal applicant to filter the list.
Customer Satisfaction Index
A bar chart that helps the manager see how customers rate the quality of request handling.
When a customer accepts the result of a request, they give a rating from one to five. The chart displays the number of requests for each rating.
Hover over a bar to see the number of requests that received that rating.
Channel Statistics
The manager can evaluate how popular and convenient the connected request submission channels are for clients and analyze potential issues with live chats. The report shows the number of requests received via each channel.
To view the data, select or specify the request period, choose the desired type, and select a service.
You can also choose how to display the channel metrics: with line and channel names, or by channel type only. Use the Channel display option for this.
You can export the report data to an .xlsx or .pdf file for archiving or presentation purposes. To do this, click the ![]() icon above the data table, select a format, and click Generate. Then download the generated file to your computer.
icon above the data table, select a format, and click Generate. Then download the generated file to your computer.
Found a typo? Select it and press Ctrl+Enter to send us feedback