The interface designer has a debugging feature. It helps you check how the custom widgets that you have created work. It also checks your scripts and shows you how the pages and forms will look without having to publish them.
To check your interfaces, take the following steps:
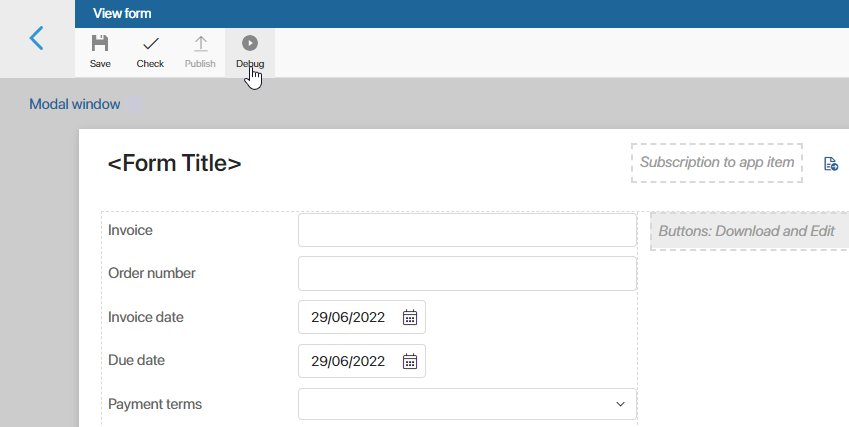
- Click Debug in the top toolbar of the interface designer.

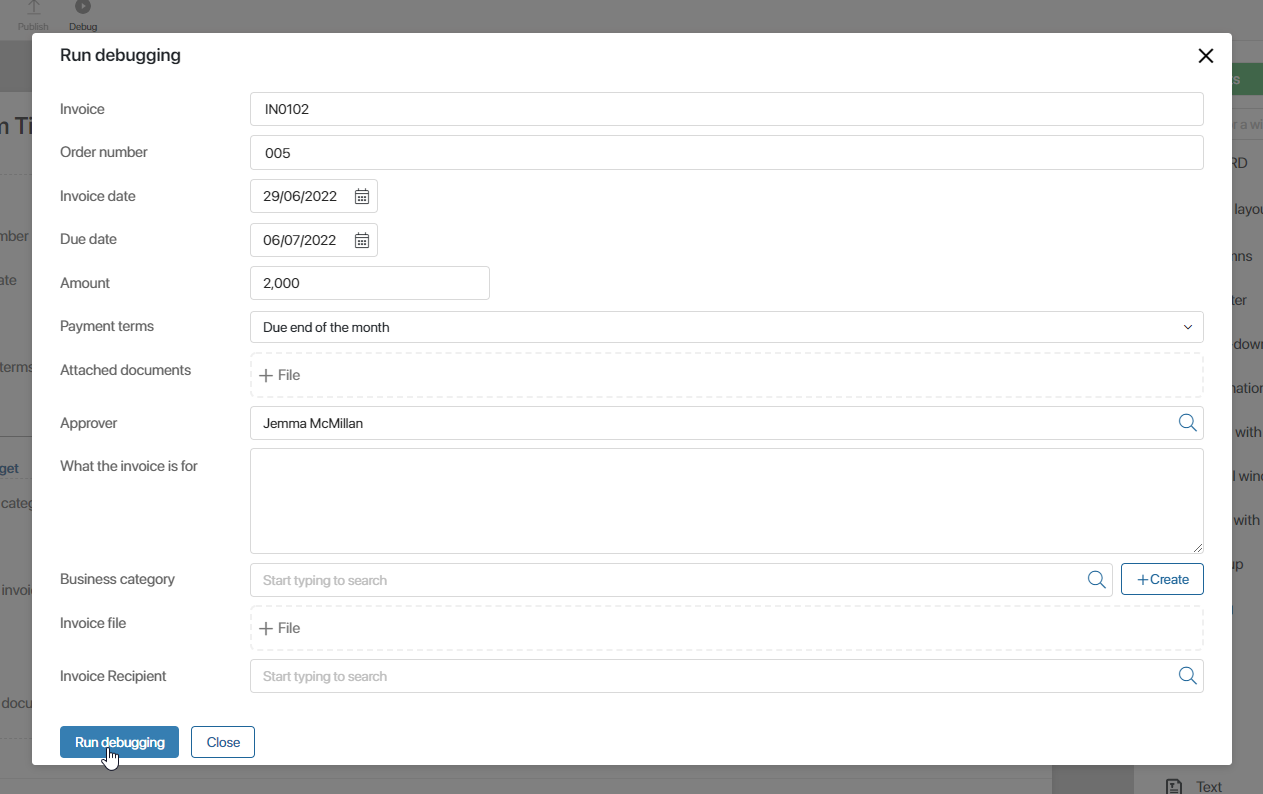
- A window will open with all the fields that you have added to your form or page. Fill them in and click Run debugging.

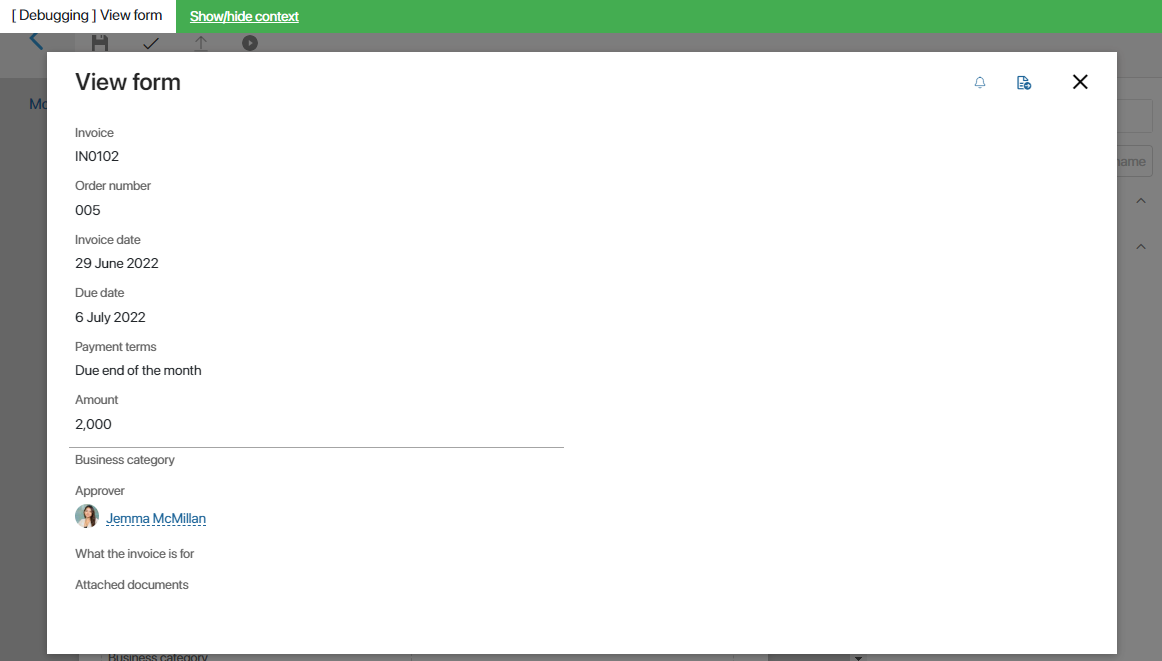
- The debugging window will open showing you the interface as it will look like for users after the form, widget,or page is published.

- You can change the properties of widgets and forms that you added via the Context tab. For example, you can change the value of a variable that is used to set up a widget's visibility. To do that, click Show/hide context in the top toolbar of the debugging window. Enter the new values and click Run debugging.
- To exit debugging, click on the cross in the top right corner.
This way you can check how scripts and widgets work in your interfaces before actually publishing them. Users will not see these changes and will keep working with forms and pages as usual, until their are published.
Was this helpful?
Found a typo? Select it and press Ctrl+Enter to send us feedback