Horizontal Pod Autoscaling (HPA) is a key mechanism for ensuring fault tolerance and resource optimization in Kubernetes. To efficiently configure HPA, regularly analyze its monitoring data. This will help prevent resource overuse and degraded cluster performance under load.
This article covers:
- How to read data in HPA graphs and the resource consumption table.
- How to configure optimal resource requirements and limits for containers.
- How to identify and reduce excess load from the service mesh (Linkerd, Istio).
Prerequisites for using the HPA dashboard
For the HPA dashboard to function correctly:
- Enable service autoscaling in BRIX.
- Install:
- Prometheus and Grafana for storing and displaying data. For more information, see Install monitoring tools.
- Loki for collecting and storing system logs.
- Linkerd or Istio for configuring connections between services and monitor connection parameters.
After this, dashboard data will be accumulated in the Prometheus repository and visualized using Grafana.
HPA-based parameter tuning
To ensure optimal resource allocation in the cluster, regularly analyze resource consumption metrics and make necessary adjustments to the horizontal pod autoscaling (HPA) settings. Let's look at the main steps of this monitoring.
Step 1: Analyze key resource consumption metrics
The Resources table displays the current resource status for the BRIX application services. For each service:
- Configure CPU usage parameters. To do this:
- Compare the maximum CPU consumption (Max) and the percentage of limit usage (% Max).
- If % Max exceeds 80%, increase the limit in the values-brix365.yaml file in the settings block for the desired service.
- If % Max is below 50%, decrease the limit to optimize resources.
- Set the guaranteed resource consumption (Req) between the average and maximum values.
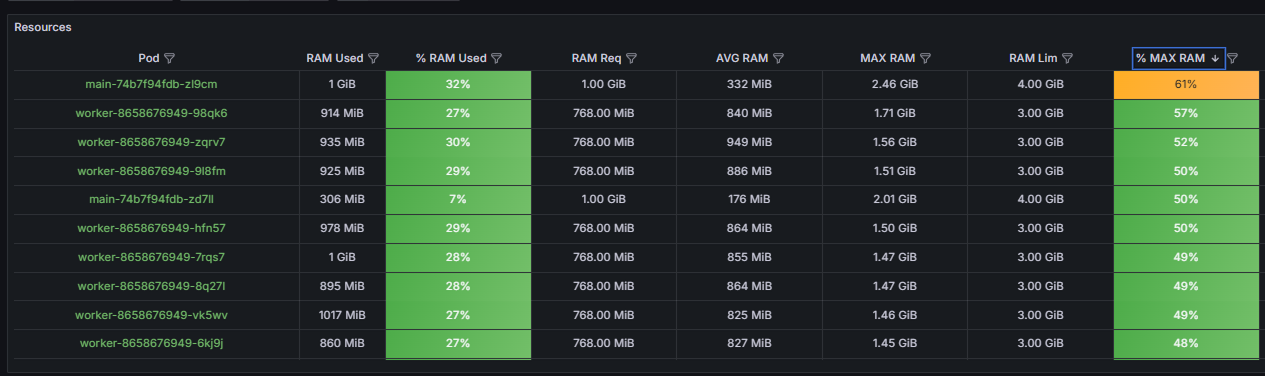
- Adjust RAM parameters. To do this:
- Make sure the % Max limit usage percentage does not exceed 80%.
- If it exceeds this value, increase the limit (Lim).
- Set the guaranteed resource consumption (memory.req) 10‑15% higher than the maximum consumption (Max).
For more information on working with data in the Resources table, see the Analyze the current resource state and tune parameters section.
Step 2: Analyze autoscaling status
Check the Autoscaling graph to track the dynamics of replicas by service. For more information, see the section Analyze HPA behavior section.
Step 3: Optimize the load from the service mesh
Analyze:
- Mesh CPU Usage and Mesh Memory Usage graphs.
- Resource consumption for each BRIX application service in detailed blocks.
If you find high load from the service mesh (Linkerd or Istio), add annotations to the values-brix365.yaml file to limit the resources of the sidecar containers:
- For Istio:
sidecar.istio.io/proxyCPU: "100m"
sidecar.istio.io/proxyMemory: "128Mi"
- For Linkerd:
config.linkerd.io/proxy-cpu-limit: "0.5"
config.linkerd.io/proxy-cpu-request: "0.1"
config.linkerd.io/proxy-memory-limit: 128Mi
config.linkerd.io/proxy-memory-request: 64Mi
Step 4: Recalculate HPA targets
After changing the guaranteed resources (Req), limits, and service mesh (Linkerd or Istio) parameters, recalculate the HPA targets. To ensure optimal and efficient cluster operation, regularly run the "Analyze HPA dashboard → Configure resource consumption parameters → Reanalyze HPA" cycle.
Analyze the current resource state and tune parameters
The Resources table displays key metrics about the resources used by pods:
- CPU utilization.
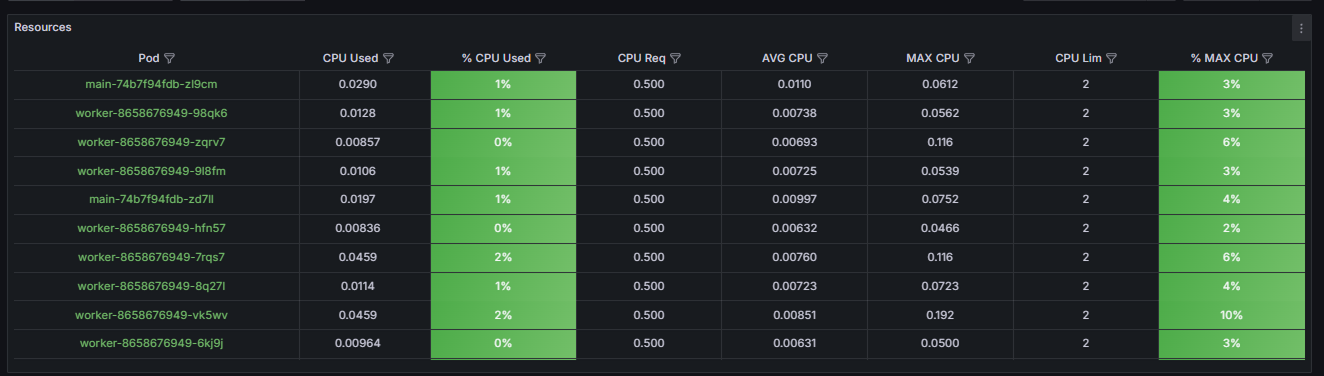
- RAM consumption.
Let's take a closer look at how to read the data in the table:
- Used.
Indicates how much resources are currently consumed by the deployment pods: RAM and CPU. To define if the current settings are correct, compare the Used value with the guaranteed resources (Req) and limits (Lim). If the Used value approaches the value in the Lim column, this means that the resources allocated to the pods have reached the set limit. In the values‑brix365.yaml file, increase pod scaling or set a higher value for the limits parameter.
- % Used.
Displays the current percentage of the resource limit used, which is displayed in the Lim column:
- % CPU Used. The acceptable load level is up to 80%. If this threshold is regularly exceeded, the HPA mechanism should automatically increase the number of pod instances. If autoscaling does not occur, check the HPA settings: maximum number of instances and scaling rate.
Important: A % CPU Used value greater than 95% creates a risk of the pod slowdown (CPU throttling). In this case, increase the pod's memory limit or wait for autoscaling if it is configured correctly but hasn't yet responded to the limit being reached. - % RAM Used. If the value of this parameter is:
- Above 60%, the cell in the table is marked yellow. Monitor the pod's status.
- Above 80%, the cell in the table is marked red. Urgent adjustments to resource allocation settings are required.
High memory usage increases the risk of forced pod termination due to exhaustion of available resources (OOMKilled). A situation where % Ram Used is high and % CPU Used is low indicates a memory leak or excessively strict limits. Adjust them in the values‑brix365.yaml file by increasing the limits parameter for the desired service.
- Req (requests parameter).
Displays the guaranteed resources reserved in the cluster for deployment. The optimal value for this parameter should be between the average (AVG) and maximum (MAX) resource consumption:
- For CPU, set the Req value in the range of p75‑p90 of the maximum consumption over a 24‑hour period. For example, if the maximum consumption (MAX CPU) is 500m and the average (AVG) is 100m, we recommend setting Req: 300m. This approach ensures that resources are available for standard peak loads without over‑reserving resources.
- For RAM, set the Req value close to the maximum with a reserve of 10‑15%. For example, if the maximum memory consumption is 1GiB, set memory.req: 1100Mi. This will prevent pod eviction during expected memory peaks.
- AVG.
Displays the average resource consumption over a 24‑hour period. Allows you to analyze the baseline load. It is used to estimate operating costs and plan the availability of necessary resources. If the set guaranteed value (Req) is many times higher than the average consumption (AVG) — by 3‑5 times — this may indicate over‑reserving of the resources and inefficient costs. - MAX.
Displays the maximum resource consumption over a 24‑hour period. This metric is key for correctly setting limits and assessing peak load:
- For CPU usage, the limit should exceed the maximum consumption (MAX). A ratio of 1.2‑1.5 is recommended. For example, if the maximum consumption (MAX CPU) is 800m, set cpu.lim: 1000m. This will provide a reserve of resources to handle unexpected load peaks.
- For RAM, the limit is set slightly higher than the maximum consumption (MAX); 10‑20% is sufficient. The goal is to prevent the node from exhausting all available memory in the event of an error. For example, if the maximum memory consumption is 1.2GiB, set memory.lim: 1400Mi.
- Lim (limits parameter).
Defines a hard limit for the maximum resource consumption of pods. Adjust this parameter after analyzing the MAX and % Used metrics. A consistently high value in the % Max column indicates that the limit is set too tightly. This may limit pod performance. - % Max.
Displays the percentage of maximum resource consumption over a 24-hour period relative to the set limit (Lim column). This metric serves as the primary indicator of the correctness of the configured pod limits.
Recommended values:
- For CPU. In the range of 70‑90%. This value indicates that resource usage may approach the limit during peak load. However, this will not lead to pod performance problems (CPU throttling).
- For RAM. Less than 85%.
Resource consumption limits need to be adjusted:
- For the CPU:
- If the % Max value exceeds 95%, the limit is not set high enough. Increase it.
- If the % Max value is less than 50%, the limit is excessive and can be reduced to more effectively distribute the load across the cluster nodes.
- For RAM: If the % Max value exceeds 90%, this indicates a critical resource shortage. Increase the limit.
Analyze HPA behavior
On the Autoscaling graph, you can see how the number of running replicas changes by service.
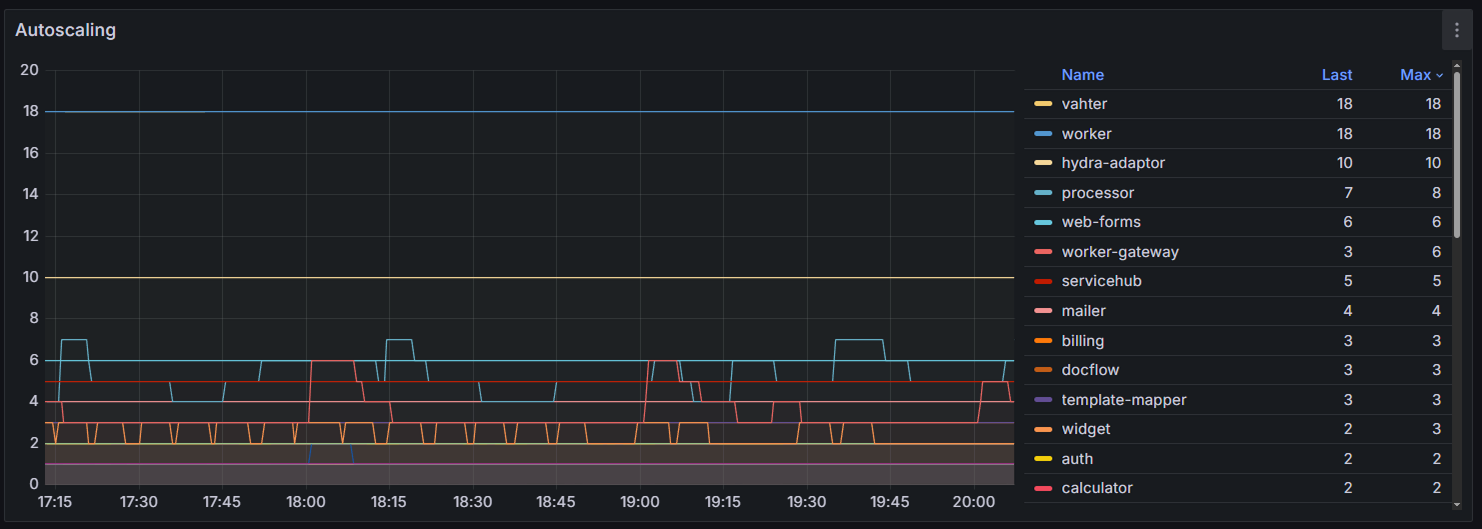
Pay attention to the following:
- Sharp and frequent fluctuations in the number of pods indicate excessive sensitivity of the HPA setting.
- A gradual, stepwise increase in the number of pods followed by a sharp decrease indicates daily load. Ensure that the HPA mechanism has time to add service replicas before the peak load.
- A straight line at the maxReplicas parameter level indicates the autoscaling limit has been reached. If the Resources table shows a consistently high % Used value, increase the maxReplicas parameter in the values‑brix365.yaml file or optimize the application by increasing the limits for the relevant service.
Resource consumption by auxiliary tools
On the Mesh CPU Usage and Mesh Memory Usage graphs, you can evaluate the resource consumption by the sidecar containers of the Linkerd (linkerd‑proxy) or Istio (istio‑proxy) add‑ons for each service. You can determine the service mesh used when setting up your infrastructure.
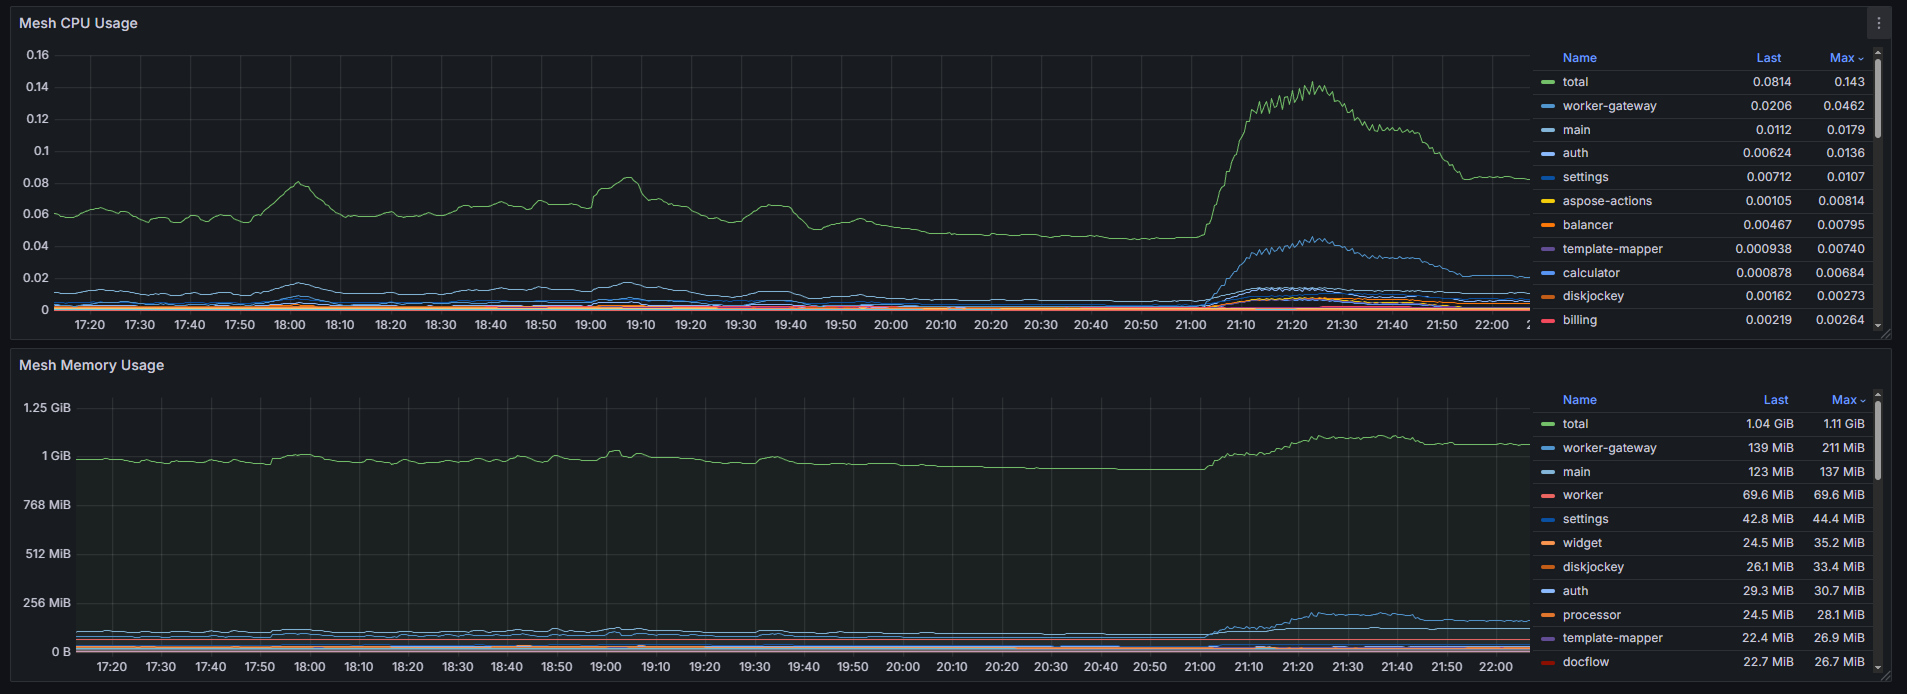
When analyzing resource consumption by sidecar containers:
- Compare Mesh CPU Usage with the overall cluster CPU Usage. If the share of CPU resources used by sidecar containers exceeds 10‑15% of the total cluster consumption, this indicates significant costs on additional resources.
- Compare Mesh Memory Usage with the Memory Usage of services. If the memory consumed by sidecar containers is 30‑50% or more of the service memory, optimization is required.
- Identify pods with high loads from sidecar containers. The graph can be used to determine when or on which services the load on Linkerd or Istio increases, for example, during mass sending of events.
You can optimize resource consumption for the service mesh (Linkerd, Istio) using annotations in the values‑brix365.yaml file.
Analyze resource consumption for each service
In the HPA dashboard, you can also view detailed blocks of resource consumption data for each service, for example, main:
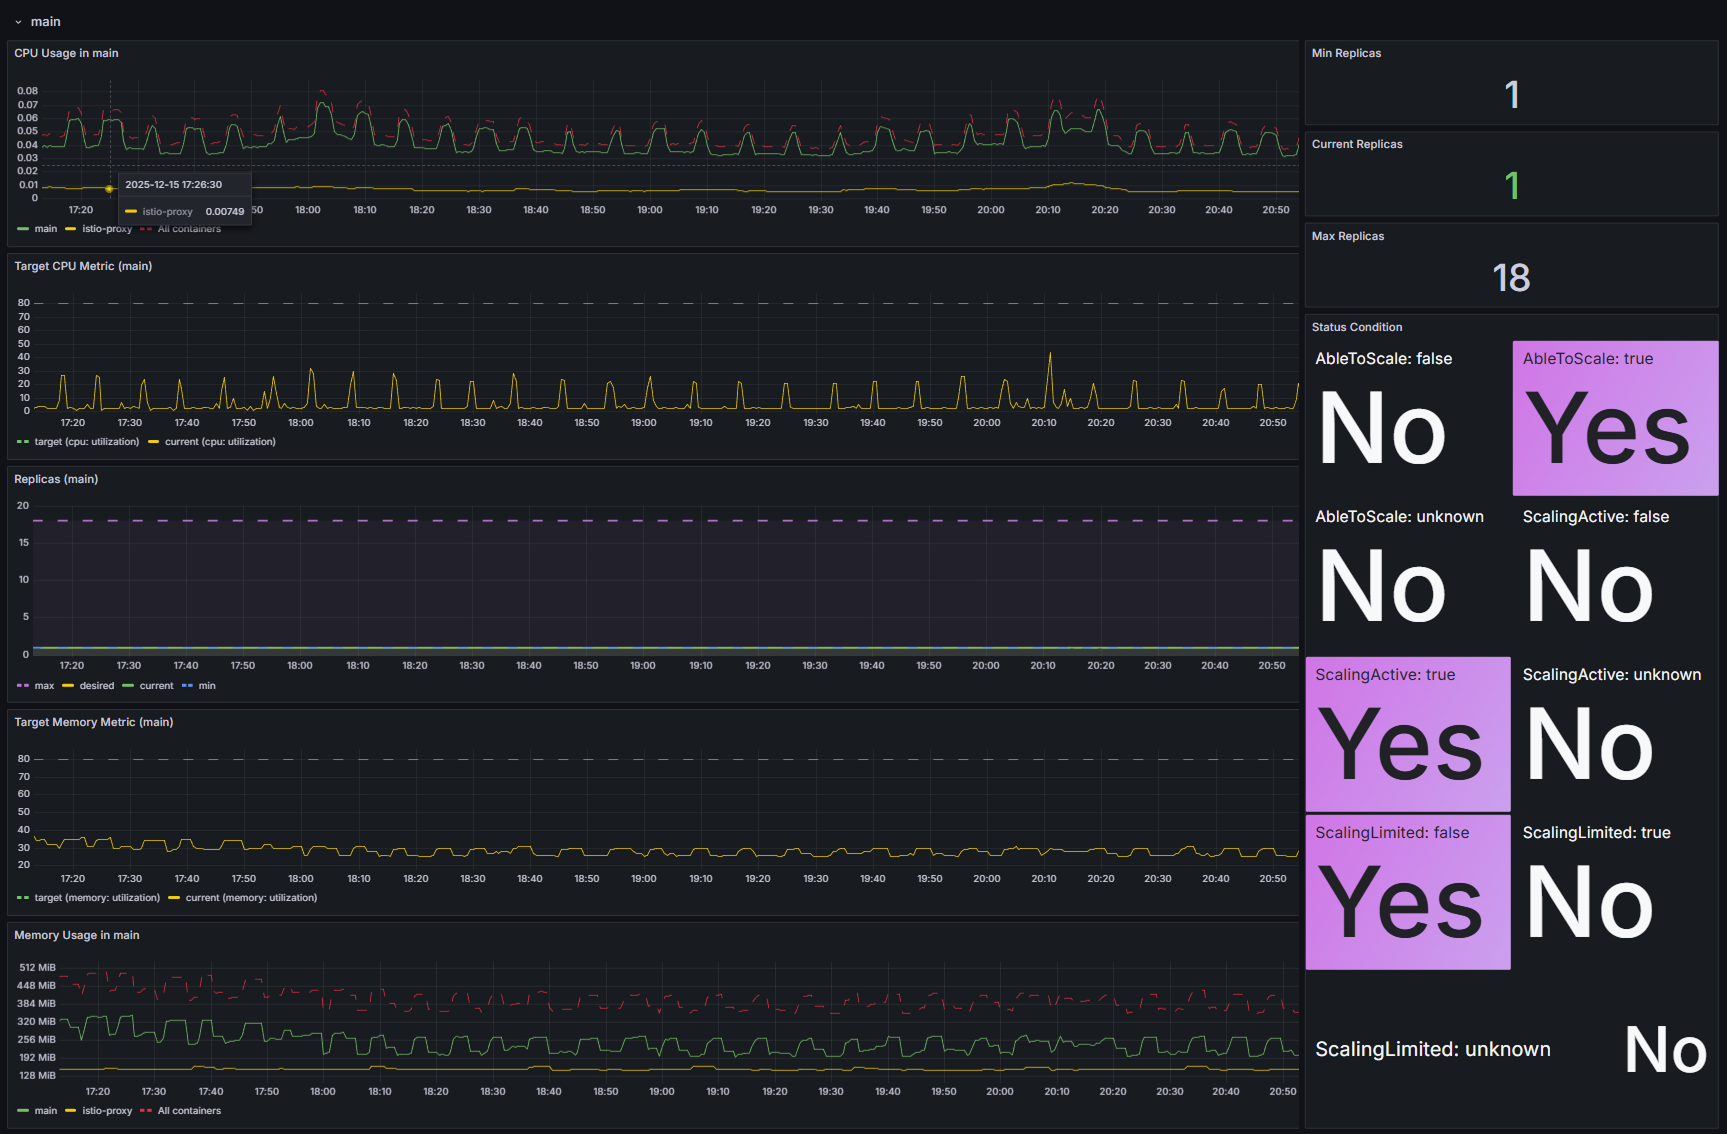
Analyze this data to optimally configure pod autoscaling for a specific service. Let's look at what to look for in the graphs:
- CPU Usage. Displays the CPU consumption of the service's main containers and Istio or Linkerd sidecar containers. If the sidecar containers' consumption is comparable to or exceeds the main containers' consumption, optimize your Istio or Linkerd configuration.
- Target CPU Metric. Defines the target percentage of guaranteed resource utilization (Req) that HPA strives to achieve. By adjusting this parameter, you can control the intensity of the autoscaling process.
- Replicas (Min/Max/Current). Displays the current status of replicas. If, under stable load, the current number of replicas remains at the maximum value for an extended period, we recommend:
- Increase the maxReplicas parameter in the values‑brix365.yaml file.
- Optimize resource consumption.
- Target Memory Metric. Displays the target and current memory consumption.
Important: Managing autoscaling based on memory consumption often leads to system instability. Use this approach with caution. - Memory Usage. Displays the RAM consumption of the service's main containers and Istio or Linkerd sidecar containers. If sidecar containers are using excessive resources, set limits for them. To do this, add annotations to the settings block for the desired service in the values‑brix365.yaml file.