The process of enabling monitoring for the BRIX application consists of three steps:
- Install monitoring tools.
- Make changes to the configuration file values-elma365.yaml.
- Apply monitoring parameters for BRIX Enterprise.
Step 1: Install monitoring tools
The installation of monitoring tools implies the deployment in the Kubernetes cluster of Prometheus for time series storage and Grafana for visualization. If you already have Prometheus and Grafana deployed, you can skip this step.
You can install monitoring tools in your Kubernetes cluster. For more details, see Install monitoring tools.
Step 2: Make changes to the configuration file values-elma365.yaml
Начало внимание
Before editing the values-elma365.yaml file, make a backup copy of it, as incorrect parameter settings may cause BRIX application malfunction.
Конец внимание
Fill out the values-elma365.yaml configuration file to enable monitoring:
- To enable monitoring support, specify
truein parameterglobal.monitoring.enabled. - Enable the installation in the Kubernetes cluster of ServiceMonitor for BRIX application services by specifying
truein theglobal.monitoring.metrics.enabledparameter.
By default, only the basic metrics of BRIX services are given. Providing all metrics is disabled to prevent the monitoring system from being overwhelmed by too many metrics. To enable the provision of a significantly larger number of metrics by the BRIX application services, specifytruein theglobal.monitoring.metrics.allparameter.
Within the scope of this article, enabling the provision of all metrics is not required.
Additional parameters for ServiceMonitor
|
- If the Kubernetes cluster is deployed on the Deckhouse platform, set the
deckhousevalue in theglobal.monitoring.provisionerparameter. This will configure the supplied monitoring tools for the target platform. - To install Dashboards (ConfigMap) in the Kubernetes cluster for BRIX application services, specify
truein theglobal.monitoring.dashboard.enabledparameter. - If the installation of alerts is needed, set
trueforglobal.monitoring.alerts.enabled. This will start the installation of PrometheusRule (CRD) in the Kubernetes cluster for BRIX application services. - To configure trace routing, use the
global.monitoring.jaegerCollectorEndpoint(highest priority, direct sending to the collector) orglobal.monitoring.jaegerAgentAddress(sending via the Jaeger agent) parameter. If these settings are not specified, traces will be automatically sent to port5775of the local node.
global:
...
monitoring:
enabled: true
metrics:
enabled: true
all: false
provisioner: "k8s"
dashboard:
enabled: true
alerts:
enabled: false
jaegerAgentAddress: "jaeger-agent.monitoring.svc.cluster.local:5775"
jaegerCollectorEndpoint: "http://tempo.monitoring.svc.cluster.local:14268/api/traces"
- To enable export of system performance metrics to the Prometheus storage for data visualization using Grafana, set
trueforglobal.monitoring.lowcode.metricExportEnabled.
global:
...
monitoring:
enabled: true
metrics:
enabled: true
all: false
provisioner: "k8s"
dashboard:
enabled: true
alerts:
enabled: false
...
Step 3: Apply monitoring parameters for BRIX Enterprise
You can update monitoring parameters for BRIX Enterprise in two ways: online and offline.
Update parameters online
- Determine the version of the chart with which the BRIX application was installed or updated:
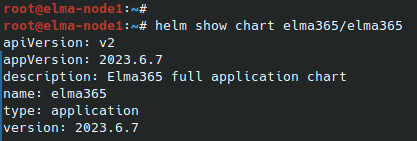
helm show chart elma365/elma365
Example of command execution:

After the command execution, you see the chart version information in the version string. Save this value for the next step.
- Update the parameters using the
values-elma365.yamlconfiguration file. To do this, execute the following command specifying the installed chart version for the--versionflag instead of<elma365-chart-version>:
helm upgrade --install elma365 elma365/elma365 -f values-elma365.yaml --version <elma365-chart-version> --timeout=30m --wait [-n namespace]
Update parameters offline
Go to directory with downloaded BRIX chart and run the following command:
helm upgrade --install elma365 ./elma365 -f values-elma365.yaml --timeout=30m --wait [-n namespace]
It takes about 10-30 minutes to update the parameters. Wait for it to complete.
Found a typo? Select it and press Ctrl+Enter to send us feedback