You can diagnose events and actions in the system to evaluate their performance using the following tools:
- Widget Debugging. It analyzes scripts of custom widgets, forms, and pages. It helps to understand why a page doesn’t respond or why a task or an app page takes a long time to open.
- Download Logs option. It allows users to retrieve data about events in the system on any of its pages. The downloaded log file can be passed to the administrator for analysis and resolution of performance issues.
- Performance Report. It enables the generation of reports containing diagnostic information about the system's operation, such as the execution time of external and internal web requests, data about triggered server scripts and database requests, as well as summary statistics on widget usage. Please note that the performance report is not available for BRIX trial version users.
- Low-code CI / CD. It is a page where components are exchanged between two companies based on the principles of Continuous integration and Continuous delivery and deploy. The tool works according to standard export and import processes. It allows you to bind companies from the same or different environments to each other and create an exchange profile for them: select components, specify the type of operation, etc. You can export or import multiple times. It is possible to check the execution of an operation before it is launched and to compare the configurations of two companies to analyze the result of the exchange.
- Tracing. It helps analyze performance and errors when executing server scripts of API methods, business process activities, event handlers, business processes, and widgets. You can choose which system components to collect data on, for example, to trace the scripts of a certain solution or module to optimize its performance. Script execution records are saved in the system for a limited period of time. They can be exported for further analysis.
- Configuration Version Management. It allows you to compare archived and current versions of solutions, workspaces, and modules, as well as log and restore their versions. If an error occurs in a solution, workspace, module, app, or other structure, you can restore an archived version and make it current.
To work with these tools, go to the Administration > Developer Tools page. Here you can:
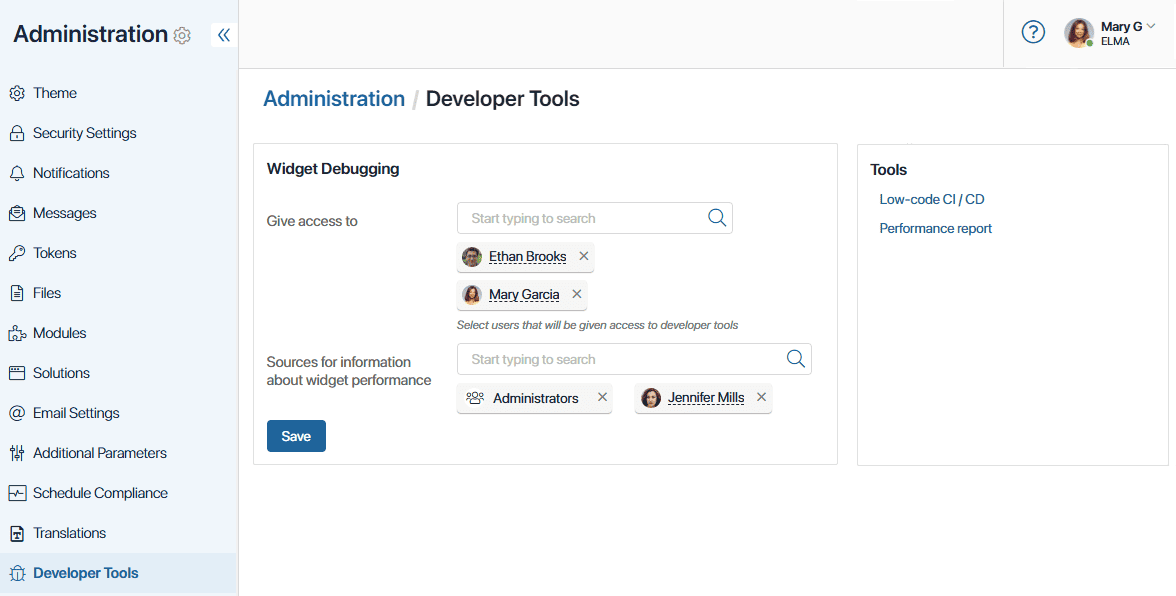
- Set parameters for widget reports:
- Give access to. Select the users to whom you want to grant permissions to the Developer Tools report and log file download.
- Sources for information about widget performance. To enable the collection of widget performance statistics, specify all employees for whom data should be recorded in the system. Performance Report will gather information on the widgets used by the selected users, user groups, or org chart items.
- Navigate to the following pages:
- Performance Report page to download system performance data in the .xlsx format to your PC.
- Low-code CI / CD page for binding with another company and component exchange operations.
- Tracing page for analyzing performance and errors during server script execution.
- Configuration Version Management. Log versions of solutions, workspaces, and modules, as well as compare and restore versions of structures within the configuration.