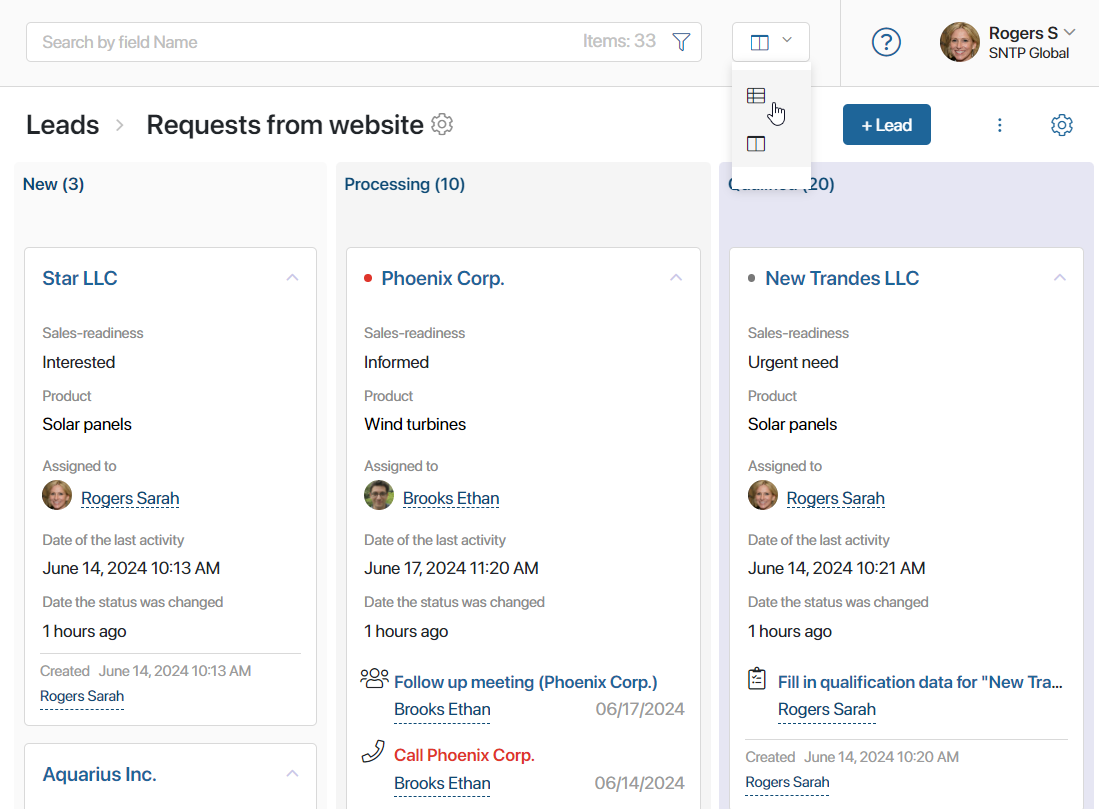
You can change the way leads are displayed in a pipeline. The default view is Kanban board. It allows you to easily monitor your prospects in real time.
If necessary, you can switch to the table view. To do that, select it in the upper right corner of the page.

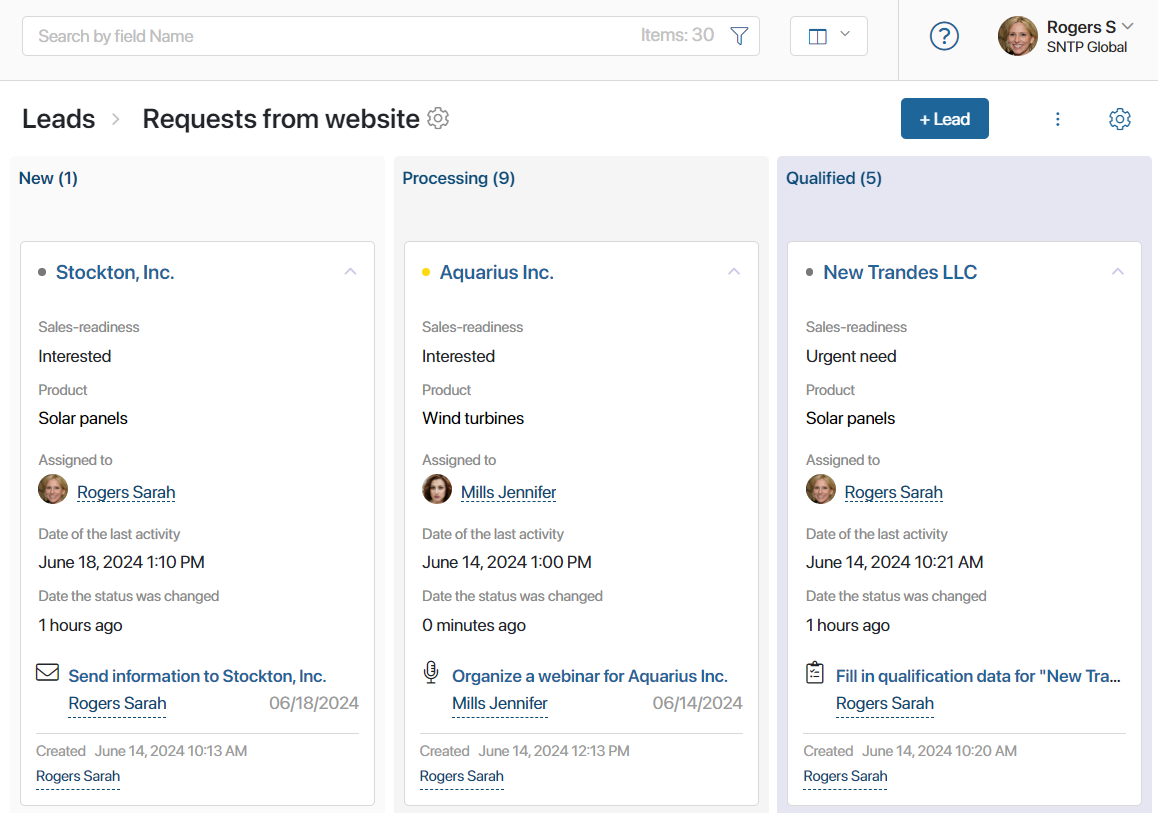
Kanban board
Each column of the board represents a certain stage of lead processing. Click on a column’s name to open a page with a complete list of leads at this stage.
The system administrator can hide or show the lead stages on the Kanban board for certain users. Depending on these settings, you will see leads in the statuses available to you.
To view all leads created in the pipeline, switch to the table view.
A default lead page contains the name of the assigned sales rep, the date of the last activity, and the current tasks associated with this lead. Leads that have associated tasks are marked with dots:
- Grey. Means that there is more than a day left until the task deadline.
- Yellow. Means that less than a day is left before the task deadline.
- Red. Marks overdue tasks.

You can change the size of leads on the board, hide tasks, sort items by parameters, select which fields should be shown, etc. To do that, click the gear icon in the upper right corner of the page and select Board Settings.
Read more about it in the Kanban board article.
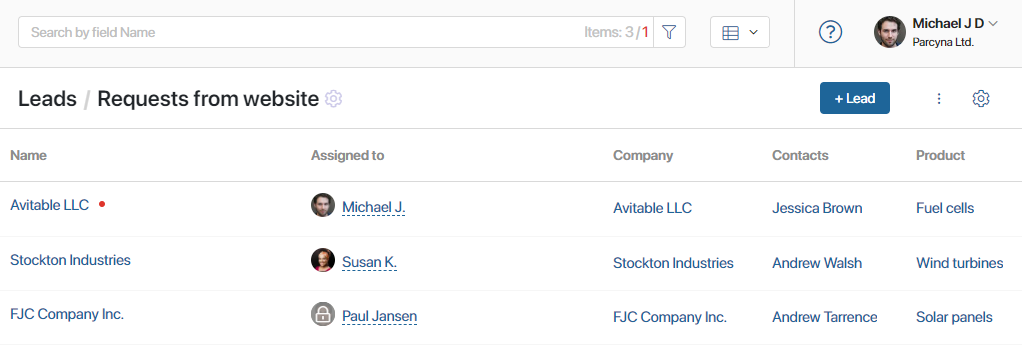
Table view
In the table view, you can customize columns by selecting app properties to be displayed. You can also sort items in the table by parameters. To do this, click the gear icon in the upper right corner of the page and select Table Settings.
Read more about table settings in the App item view article.
The table displays all the items available to you, unlike the Kanban board, where the administrator can hide the columns you are not working with.

Found a typo? Select it and press Ctrl+Enter to send us feedback