The Change Report page enables team leads to analyze the results of RFC implementations.
The page contains three reports:
Let’s review each report.
Total changes
This report displays the total number of changes for a selected period and a donut chart showing the quantity of each change type.
The report helps identify which types of RFCs are most frequently registered in the system.
To generate the report, specify the period and click Show.
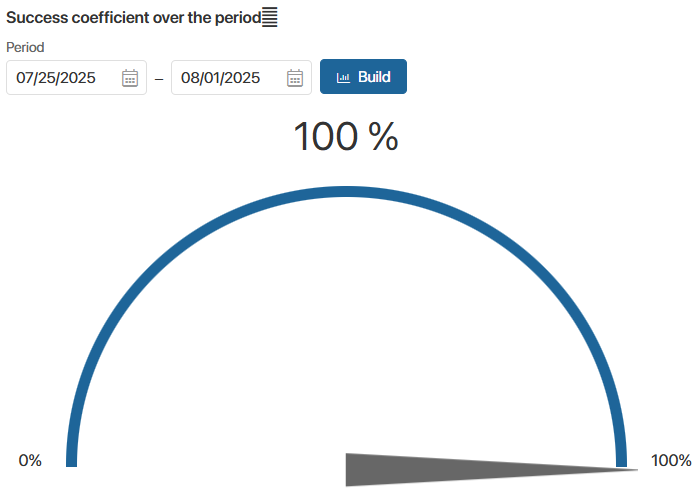
Success coefficient over the period
The chart shows the percentage of successfully implemented changes out of all closed RFCs. A low percentage indicates most RFCs are completed unsuccessfully.
To generate the report, specify the period and click Build.
Time of change application for type
The system records date and time of each RFC creation and completion. Based on this data, the report calculates average and maximum implementation time for each change type. Presented in table format, this data allows evaluation of processing speed by employees.