The article describes methods and tools for collecting diagnostic information of the BRIX application. With the collected data, it is possible to identify potential errors and slowdowns in the system, optimize page loading speed, etc.
HAR log collection
To track the process of loading pages and other resources, use HAR logs. These logs record all browser actions related to loading apps or web pages. For a list of supported browsers, see the Workstation requirements article. Instructions for collecting HAR logs are available in the help documentation for the used browsers.
Platform diagnostics
After collecting the HAR logs, run platform diagnostics to identify errors, collect service logs, and analyze them.
For diagnostic procedures, see Diagnostics and troubleshooting in BRIX On-Premises.
If you are not sure which edition you have, you can determine it by following the steps below:
- Connect to server with BRIX using SSH.
- Enter the command that will show the list of installed services:
- If the installation was performed by a script in Kind:
docker exec brix365 kubectl get pod –A
- If the installation was performed using the Helm package:
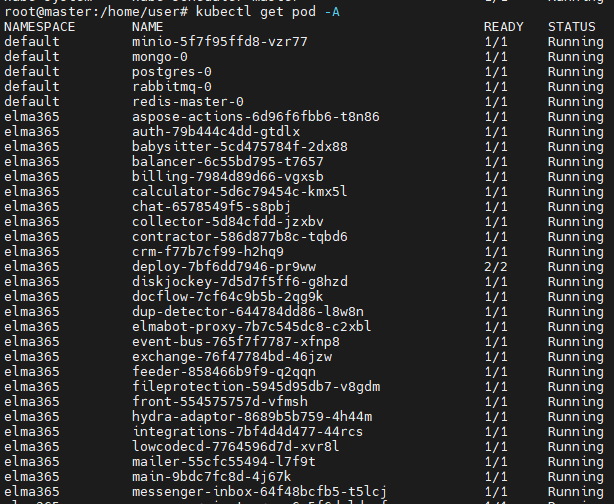
kubectl get pod -A or helm list –A
The list will look like this: