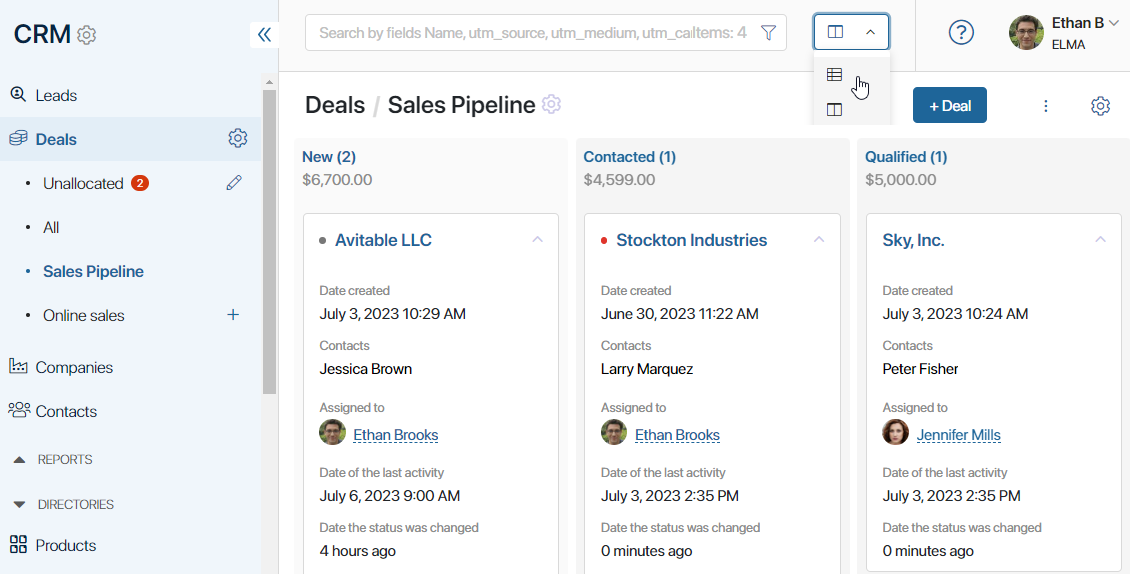
You can change the way deals are displayed in pipelines. The default view is Kanban board. It helps you track the progress of sales in real time. However, you can switch to the table view if needed. To do that, use the switch in the top right corner of the page.

Kanban board
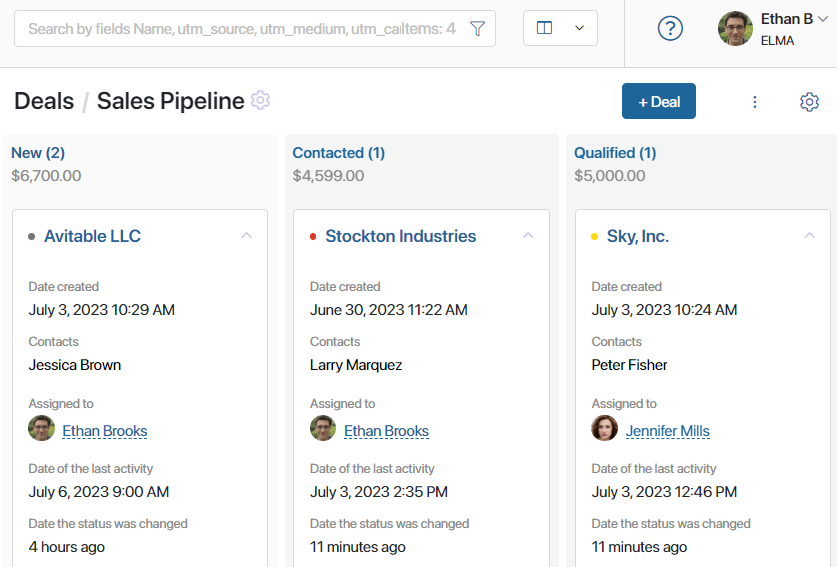
On the Kanban board, each column represents a stage of the sales process. Next to a column’s name you will see the total estimated revenue of all the deals that are currently at this stage. You can click a column’s name to see a list of deals at the corresponding stage with information about them.
The system administrator can hide or show the deal stages on the Kanban board for certain users. Depending on these settings, you will see deals in the statuses available to you.
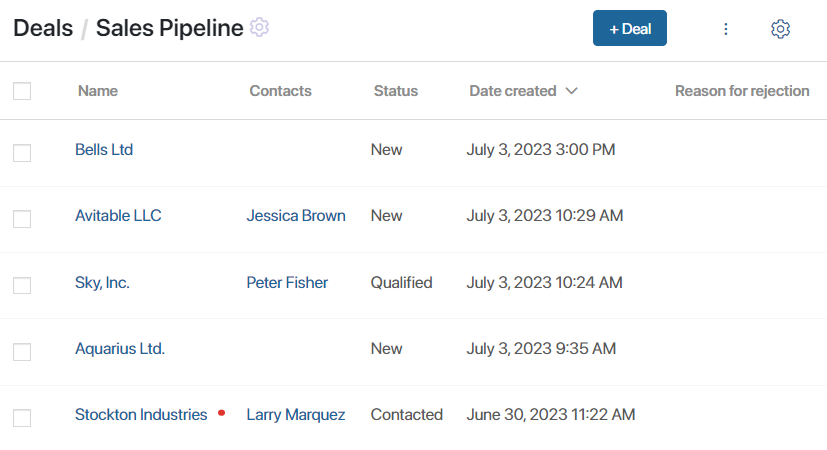
To view all deals created in the pipeline, switch to the table view.
For each deal, there is a card on the Kanban board that shows the name of the assigned sales rep and the current tasks. Deals for which tasks have been set are marked with colored dots for quick identification of urgency:
- Grey. Means that there is more than a day left until the task deadline.
- Yellow. Means that the deadline for a task is within less than a day.
- Red. Marks items with overdue tasks.

You can change the size of the cards, hide tasks, sort items by parameters, etc. To do that, click the gear icon in the upper right corner of the pipeline page and select Board Settings.
Learn more about it in the Kanban board article.
Table
When selecting the table view, you can set up the columns you need by selecting displayed app properties and sort items by parameters. To do that, click the gear icon in the upper right corner of a pipeline page and select Table Settings. Read more in the App item view article.
The table displays all the items available to you, unlike the Kanban board, where the administrator can hide the columns you are not working with.

Found a typo? Select it and press Ctrl+Enter to send us feedback