You can view information about all portable services created in custom modules on a single page.
This page provides data on the status, replicas, and metrics of each service. You can also:
- Configure notifications for services where errors have occurred.
- Open a service page to analyze the statuses and metrics of its components and logs.
начало внимание
Important: The Service Monitor page is available by default starting from system version 2025.10. In earlier versions, you need to enable two feature flags: enableModuleServices and babysitterEnableDashboard. For more details, refer to Modify BRIX parameters. If you are using the SaaS Enterprise edition, contact your BRIX rep to enable the feature flag.
конец внимание
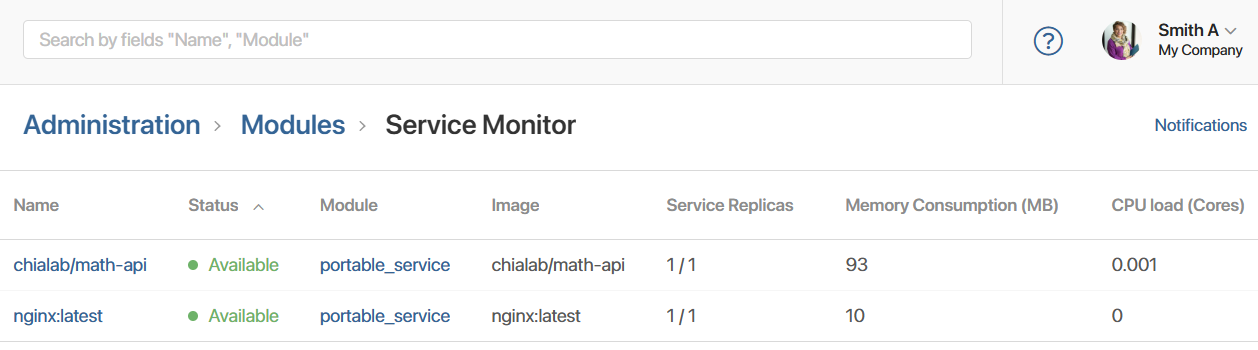
Service Monitor page
To display the list of services, go to Administration > Modules and click the Service Monitor button.
A page will open with detailed information about each service: name, status, link to the module, image address, and number of replicas. If metrics can be provided for the Kubernetes cluster, you will also see data on resource consumption and CPU load.
You can:
- Use the search bar to find a service by its name or the name of the module where it was created.
- Sort data by any table column except the Image column.
- Open the page of the module where the service is configured.
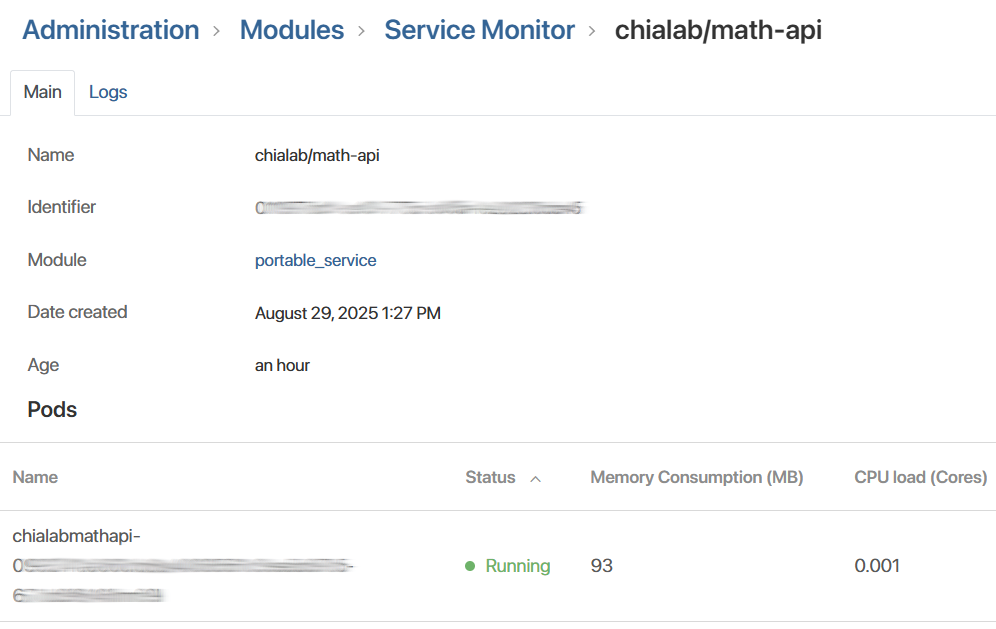
After reviewing the service metrics in the table, you can open its page to examine detailed information about the operation of its components. For example, if a service is consuming excessive resources, analyze the resource consumption data for each pod that makes up the service.
You can also configure notifications for services where errors occur. To do this, click Notifications in the upper right corner of the page, select a channel for sending alerts, and save the settings. A message will be generated automatically if a service gets the Error status. In case of a prolonged error, notifications will be sent every 24 hours.
Portable service page
You can analyze detailed information about a service on its page, for example, in case of an error or high resource consumption. To do this, click on the service name on the monitor page.
The service page consists of two tabs: Main and Logs.
Service page. Main tab
Contains service data, as well as a list of pods that make up the service, their statuses and metrics. Here you can:
- Evaluate resource consumption and CPU load for each service component.
- View the status of a pod, as well as the reason for a non-working status and error description (if available). To do this, click the
 icon to the right of the status name. Information about the cause and error will be copied to the clipboard.
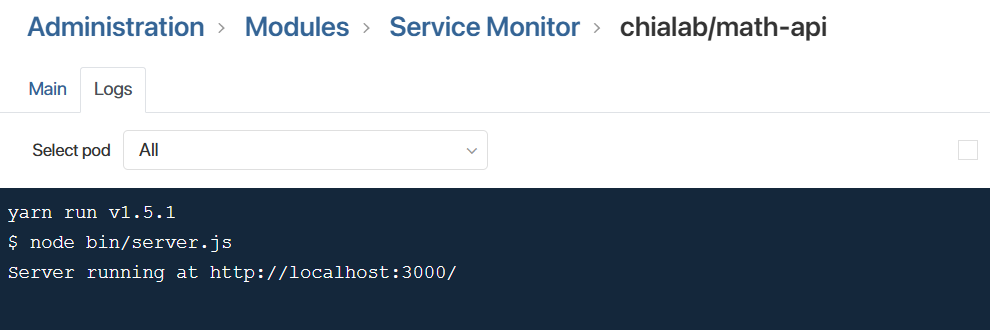
Service page. Logs tab
Displays service logs generated during its operation. It allows you to verify that the service is working correctly or analyze any errors that have occurred. You can view:
- Verify the correct operation of the service.
- Analyze information about errors that occurred in the service or its components.
- Logs for an individual service component or all components.
- The date and time for each log entry. To do this, enable the Show timestamps option.
The services monitor for a specific module is also available on its page.