Reports on the Incoming Payments page help managers analyze the company’s financial performance against its targets, monitor employee performance, forecast revenue for the next period, and adjust current plans.
The page contains three reports:
Each report is displayed on a separate tab and aggregates data on planned and actual payments and overall sales goals.
Page setup
Each report is displayed using separate widgets placed on the tabs. System administrators can configure the reports page:
- Change widget settings.
- Change the position of widgets on the tab.
- Remove charts that are not used by the company.
- Add additional system widgets.
For a list of widgets added to the page, see Report widgets in the Incoming Payments workspace. For more information about configuring a page in the interface designer, see Add a widget to a page.
Read reports
Metrics
Comparison of planned and actual financial metrics by sales teams, responsible employees, contractors, revenue items, responsibility centers and so on.
Information is displayed as charts based on data from the Register of Incoming Payments app. To view the statistics:
- On the top panel of the page, specify the period for which you want to display data.
- Specify the search parameters in the following filter fields: Sales team, Contractor, Revenue item, Assigned to, Responsibility center, Payment status.
- Click Build Report.
Two reports will be generated based on the selected data:
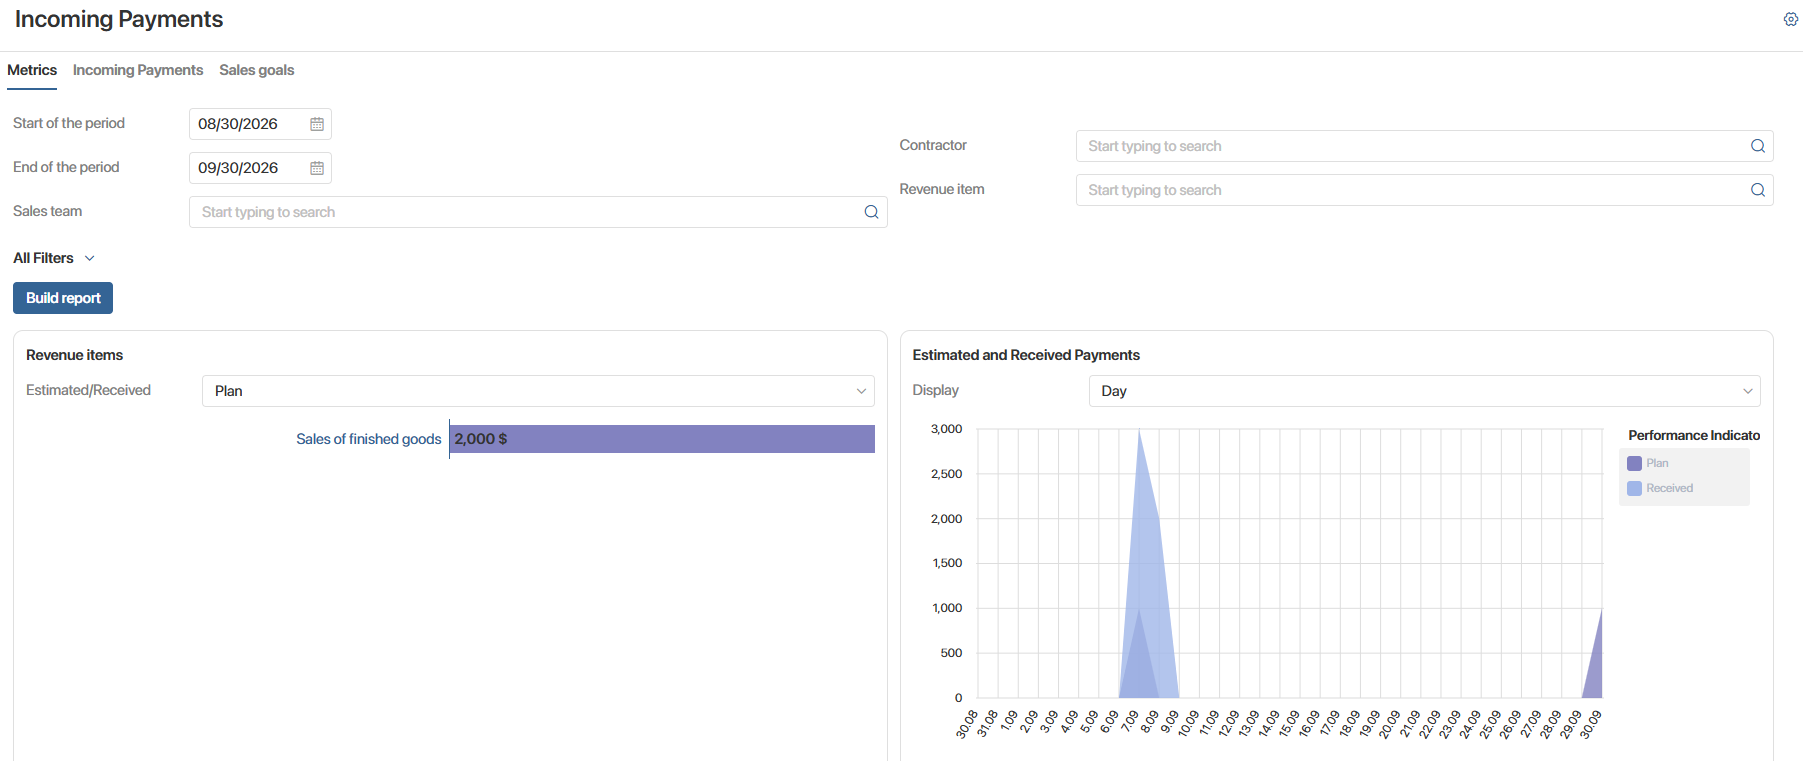
- Revenue items. The widget shows the distribution of all payments by selected revenue items. In the Plan/Received field above the chart, specify which statistics to display.
For example, this report can show which revenue item the selected sales team used most often for transactions during the current month.
- Estimated and Received Payments. The widget shows the ratio of estimated payments to received payments in a chart. You can display statistics for the entire selected period by day, week, or month. To do this, in the Display field, select the required option.
For example, this report can help a manager track daily sales goal performance for each company department.
Incoming payments
A list of the company’s estimated and received incoming payments. The report is based on data from the Register of Incoming Payments app and displayed as a table using the Receipts widget. The report shows the payment basis, estimated and actual payment dates, amount and payment status, as well as probability, whether an invoice is available, and the person in charge.
You can sort the data in the table, for example, to display only payments paid during the last month. To do this:
- Above the table, fill in Scheduled payment date and Actual payment date.
- To filter the report by other parameters, such as status or person responsible, click the filter icon. In the window that opens, fill in the fields.
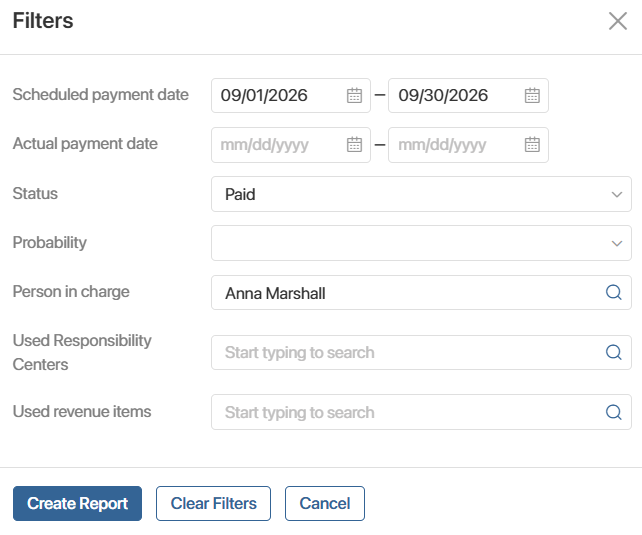
- Click Create Report.
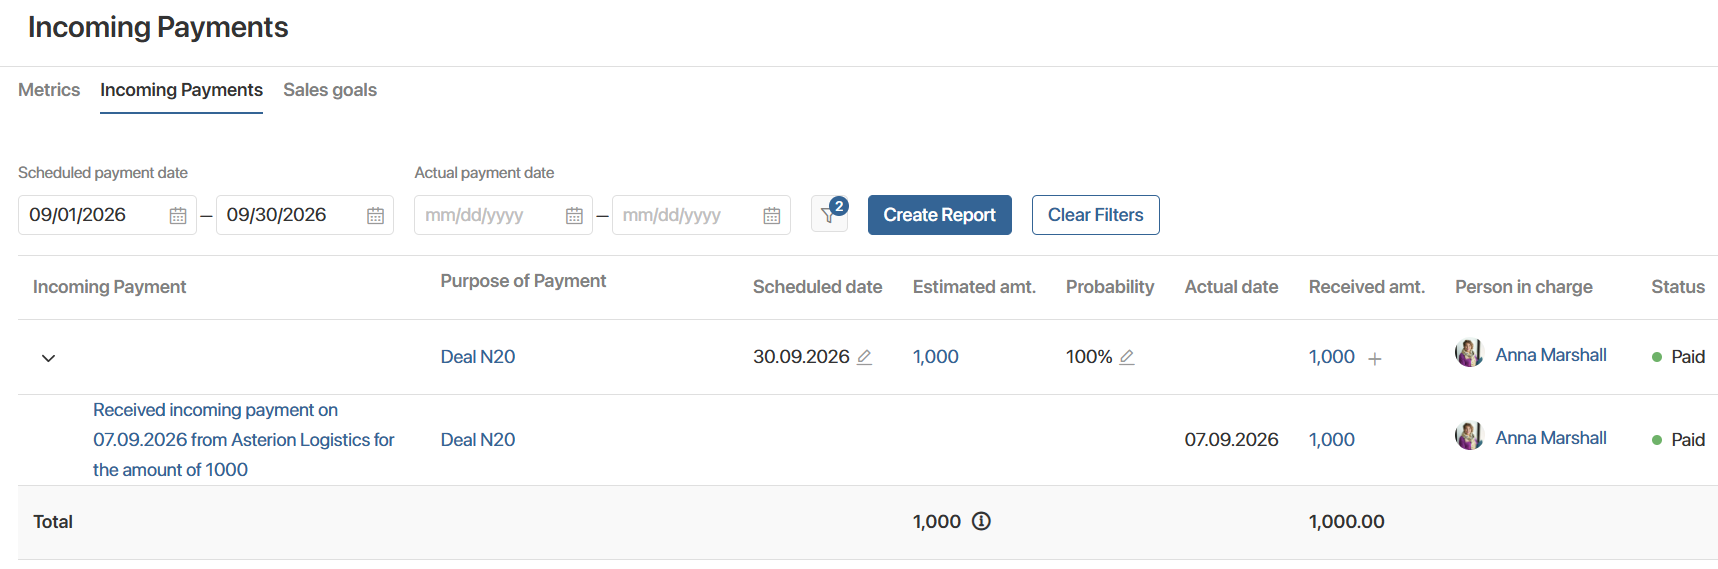
You can create a received payment from an estimated payment. To do this, click the plus sign in the Received amt. You can also edit the scheduled payment date and its probability by clicking the pencil icon next to the required value.
Sales goals
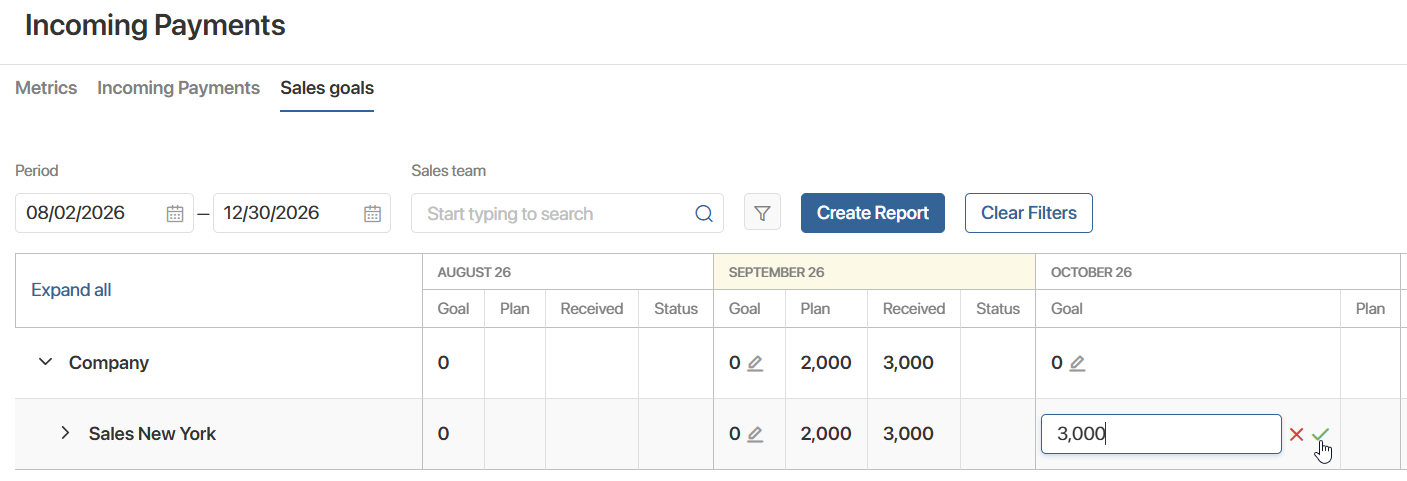
A table comparing target, planned, and actual payment amounts.
The percentage of goal completion is calculated by comparing planned and actual figures with the target value.
For example, you can see the percentage of the target achieved by the company, each sales group, and all responsible employees in the previous quarter. Based on these figures, you can forecast revenue for the next period more accurately and set achievable goals for employees.
The report is generated using the Distribute Sales Goals widget based on data from the Register of Incoming Payments and Sales Goals apps.
You can filter the report data, for example, to display statistics for only a specific sales team. To do this:
- On the top panel of the page, specify the period for which you want to display data.
- Fill in the filters: specify a sales team or a particular employee responsible for achieving the goal.
- Click Create Report.
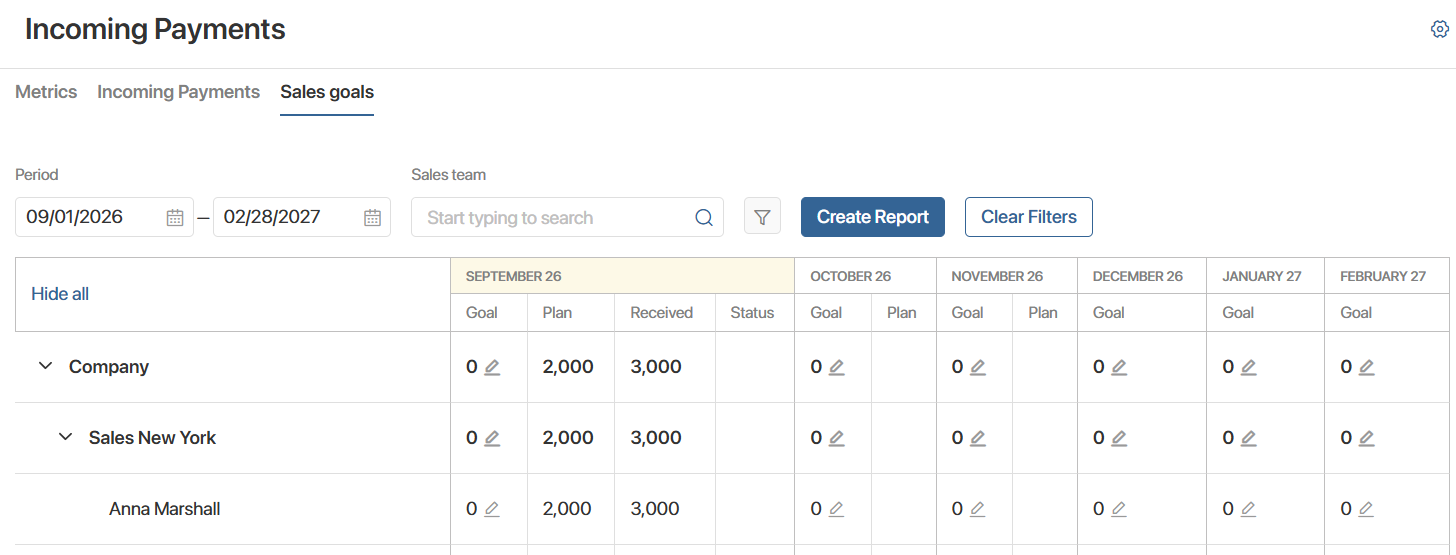
The table shows the revenue goals set for the company, sales teams, and specific employees, as well as revenue amounts from estimated and received payments.
The completion percentages for all set goals are calculated based on these figures.
Users with permission to create and edit app items of the Sales Goals app can add goals and edit their data directly in the table. The item is created or edited in the Sales Goals app.
To create or edit a sales goal, in the Goal column, select a cell and click the pencil icon. In the field that appears, enter or edit the amount and click the check icon. To cancel the action, click the cross icon.