For an AI action in BRIX AI, several debugging options are available at different setup and usage stages:
- Test the AI action in a test chat to send input data and evaluate the result.
- Enable AI action tracing to collect data on each request processing step and optimize AI action performance.
- Analyze the AI action call history when the action is already in use to see how real tasks are processed in BRIX.
Using this data, you can evaluate whether the AI action meets your requirements and find the causes of errors. You can then adjust the operation using its settings by modifying instructions, response generation parameters, input or output data formats, and available tools.
To use debugging options, go to AI Actions in the left menu of BRIX AI and select the required action from the list.
Test the AI action in a test chat
On the Test Chat tab, you can test the AI action by sending input data and analyzing responses. Data is passed in the formats specified in the AI action settings.
The chat for sending input data and viewing responses is on the left side of the page, while detailed information about the tools used is on the right. Let's look at the AI action debugging features available in the test chat.
Step 1. Send input data to the test chat
If OAuth 2.0 authorization is configured in the AI action tools, allow access to your data before using the chat. To do this, click Agree at the bottom of the tab. You can revoke access later by clicking the logout icon to the right of the input field.
After this, on the left side of the page you can:
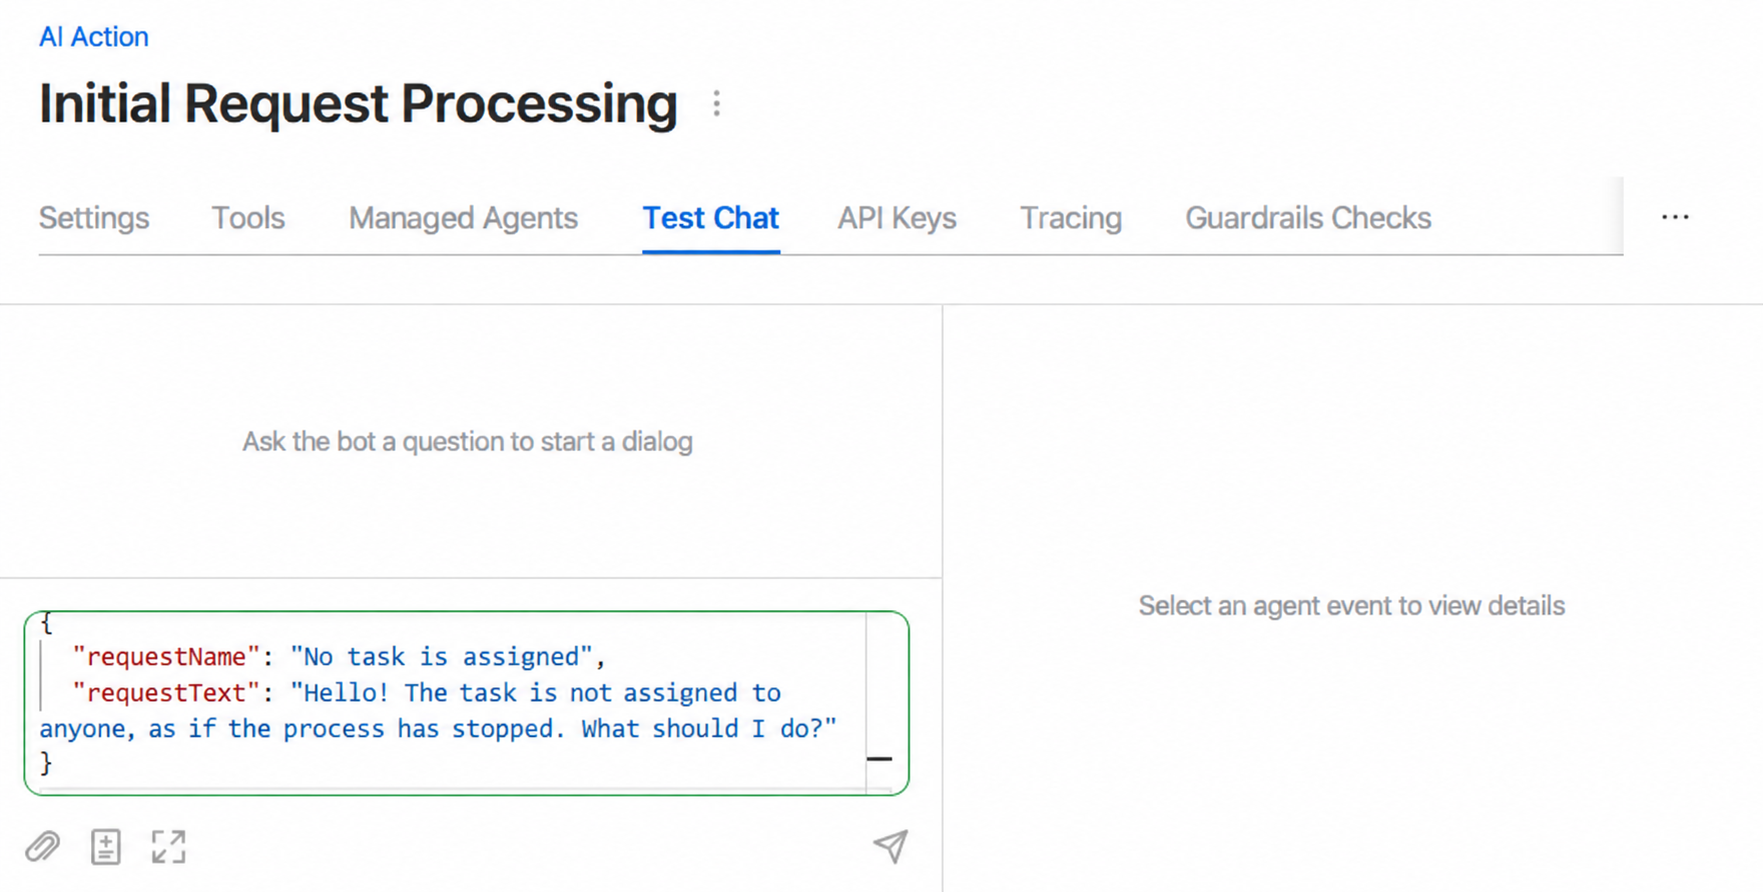
- Enter input data in the input field. Depending on the format specified during AI action setup, enter text or pass a JSON object.
If a specific JSON schema is set as the format during AI action configuration, field values are validated against the specified rules. For example, if required fields are missing or data types do not match, an error appears and you will not be able to send the message to the chat.
- Attach files by clicking the paperclip icon.
- Specify additional data sources by clicking the add resource icon
 . This allows you to set additional context for AI action responses:
- Text. Custom text supplementing the request.
- BRIX app. Link to an item in any BRIX app. The AI action reads data from its page.
- BRIX session. Link to an item in the Sessions app from the system Live Chats workspace.
- BRIX file. Link to a file from the Files workspace or an attachment on an item page in BRIX.
- Open the full-screen input window. This option is available if you pass data in JSON format. To do this, click the expand icon
 under the input field.
Each message sent to the chat is processed separately. The context of previous messages is ignored, as the AI action performs actions once per call based on input data.
Step 2. Analyze the AI action response
After sending a message, the tools used by the AI action and the generated response appear in the chat on the left. If the ReAct execution environment was selected during AI action configuration, you will also see the textual reasoning performed by the language model between tool calls.
If Guardrails checks are configured for the AI agent, you will also see any requirement violations detected in the request or response, along with explanations for the check decision.
You can:
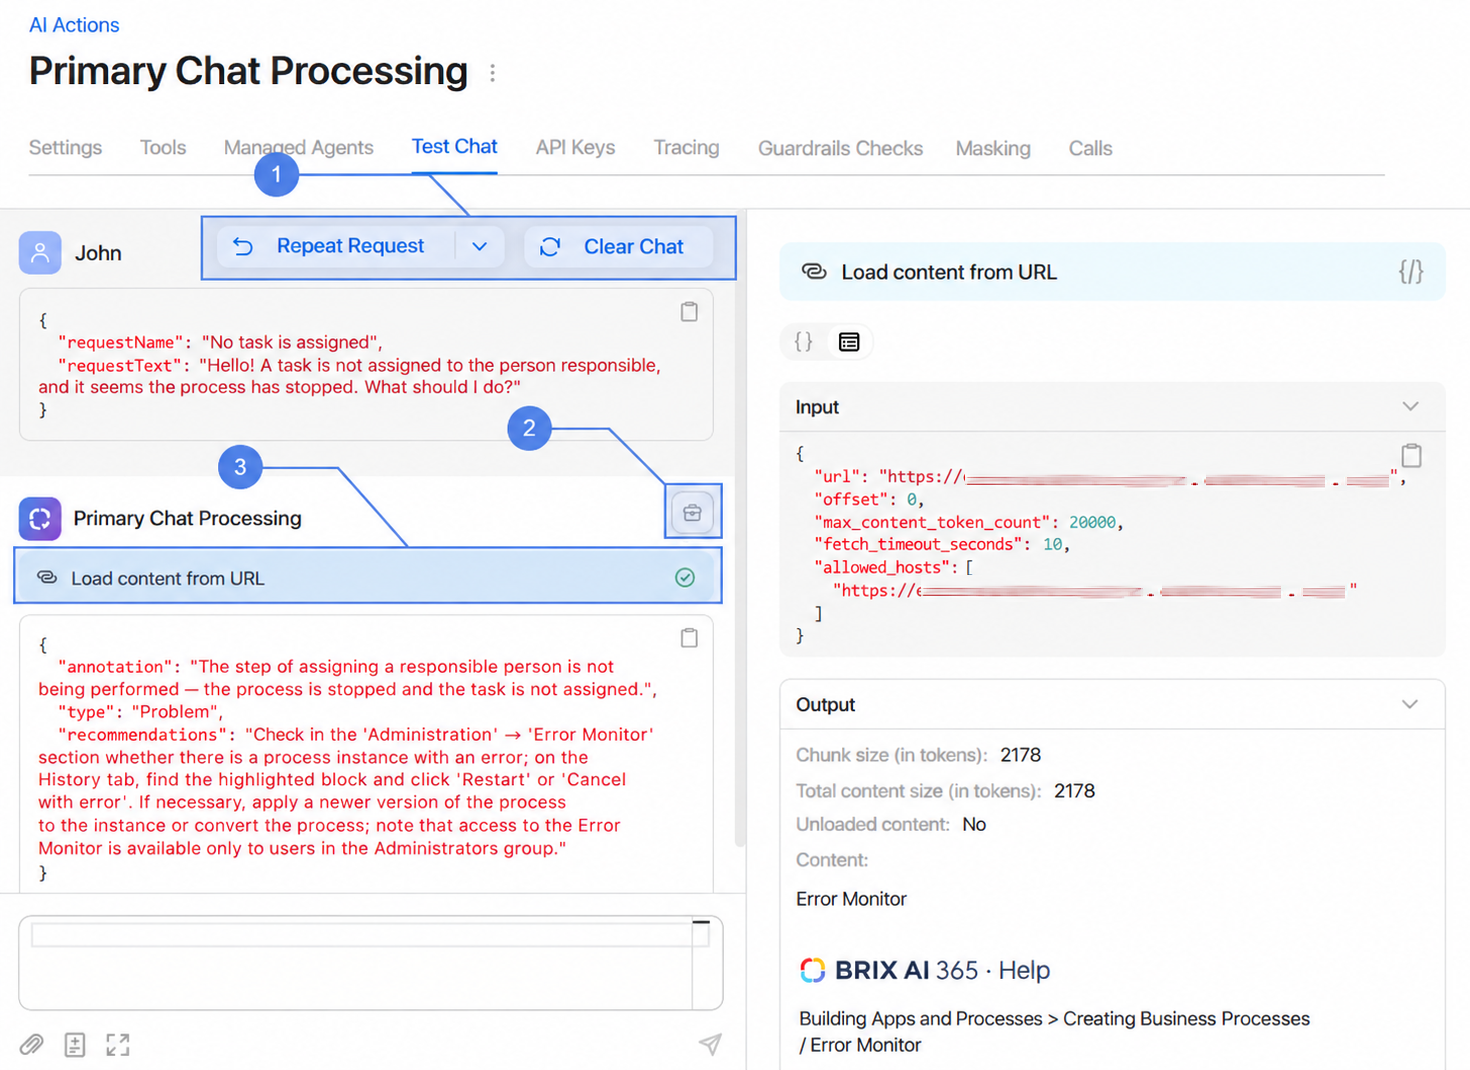
- Manage chat content using buttons:
- Resend Request. Resend your last request for processing, for example, if an error occurred. You can also send a previous request by clicking the arrow icon and selecting it from the list.
- Clear Chat. Clear request history in the test chat to apply updated AI action settings when processing subsequent messages.
- Review tools available to the AI action and their parameters. To do this, click the toolbox icon
 next to its name. In the window that opens, select a tool to view its JSON schema. It shows:
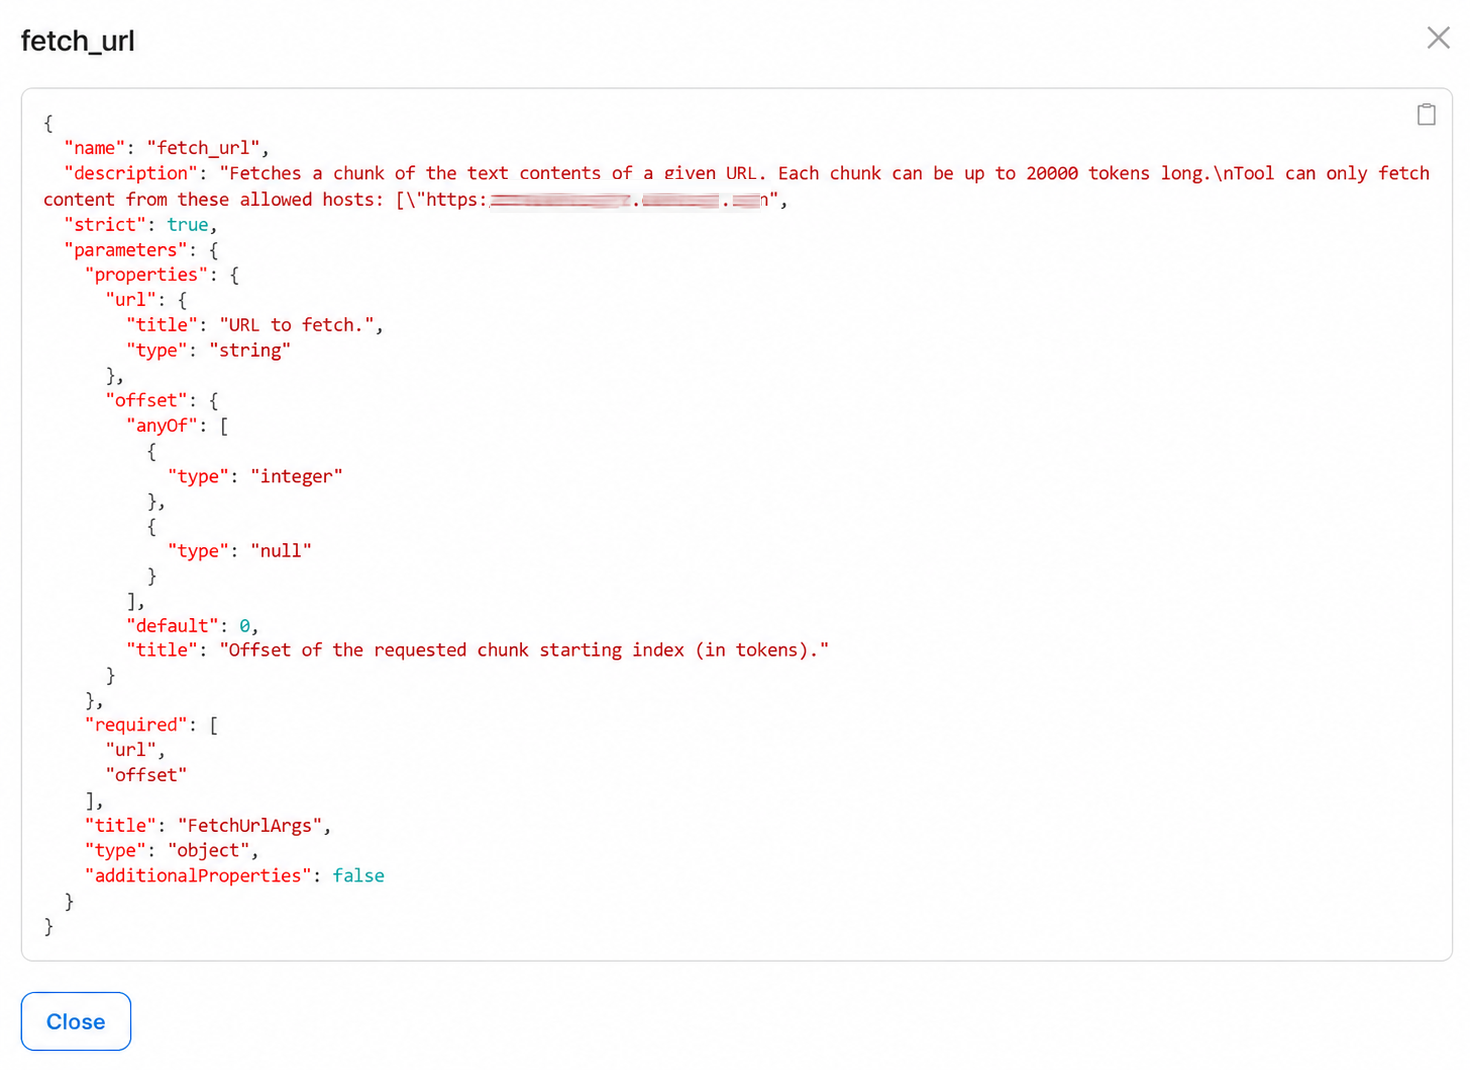
- Tool name (code).
- Tool description: Text instructions describing actions performed with the tool. The AI action uses it to determine when to apply the tool.
- Tool parameters: Properties used when executing the action, indicating data type, required status, etc. For example, in a custom BRIX toolset, a tool is configured to assign tasks to users. In its JSON schema, you will see task fields available to the AI action. If parameters are insufficient to perform the action, such as missing assignee and due date fields, go to the tool and modify its settings.
- View tool call details by clicking its text in the chat. On the right side of the page you can then:
- Go to the tool JSON schema by clicking the curly braces icon
 . The same information will be displayed as when viewing the schema in the tools list.
 - View input and output data structures. To copy a structure, click the clipboard icon
 .
.
If an error occurs while running the AI action, it is displayed in the chat like a tool call, highlighted in red. Click its name for details.
Configure AI action tracing
Use tracing to track AI action performance during request processing. You can view:
- Data received and returned by the language model.
- Token consumption for request processing.
- Tool call events.
- Latency data during response generation.
In BRIX AI, AI action tracing is performed using the Arize Phoenix platform hosted on a separate server.
Enable tracing
To use tracing:
- On the Tracing tab, enable the Enable Arize Phoenix option.
- Fill in the fields that appear:
- Phoenix Instance Address. Enter the address of your Arize Phoenix server.
- Project ID. Specify the Arize Phoenix project where AI action traces should be saved.
- Click Save.
After this, you can view traces for analysis in the specified Arize Phoenix project.
Disable data masking for tracing
If you enabled data masking when creating the AI action, it is applied by default to texts sent to the tracing service.
To analyze data in its original form, disable the Mask Tracing Data option on the Tracing tab.
View AI action call history
On the Calls tab, you can view a list of all AI action executions:
- In the test chat.
- From business processes, interfaces, and scripts in BRIX.
For each call, abbreviated input data, the response, execution status, and date are displayed. If Guardrails checks are configured for the AI action, you will also see requirement violations detected in requests or responses, along with check decision reasoning.
Click a call to view complete input data, AI action execution results, and tools, just as in the test chat.