начало внимание
This article contains instructions for the deprecated BRIX On-Premises in MicroK8s with PostgreSQL 10 database. It is supported up to system version 2024.4. Upgrading edition and database is not available. Please update to the current BRIX On-Premises edition.
конец внимание
In BRIX Enterprise, the Grafana data visualization and monitoring tool is available via http on port 32222. To access the Grafana web interface:
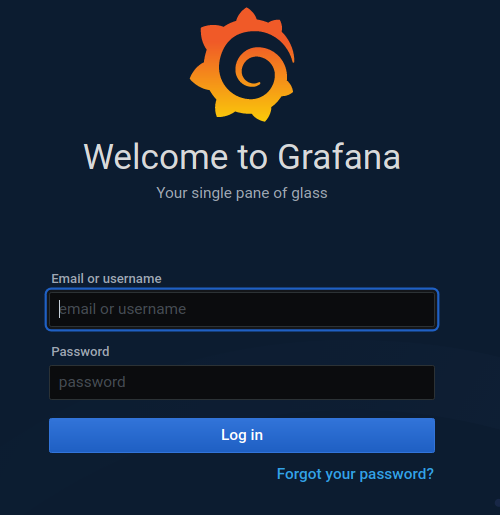
- Open a web browser. In the address bar, enter the server network address in the following format: http://<server address>:32222. The login window will appear.

- Use the login and password you set when installing BRIX. If you used a simple password during the BRIX installation, the login and password will be set to admin/admin by default.
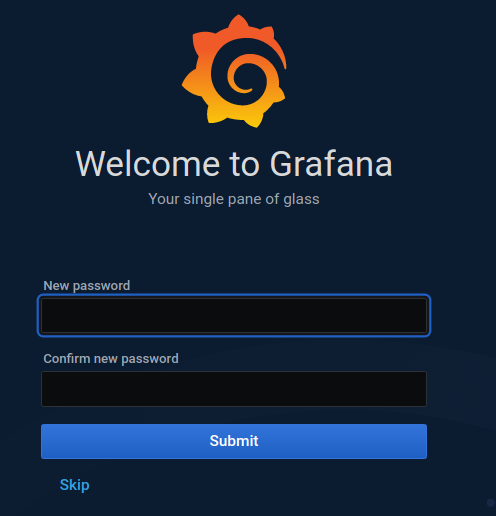
- At first login, you may be asked to change your password. Change it if necessary, or skip the step by pressing Skip.

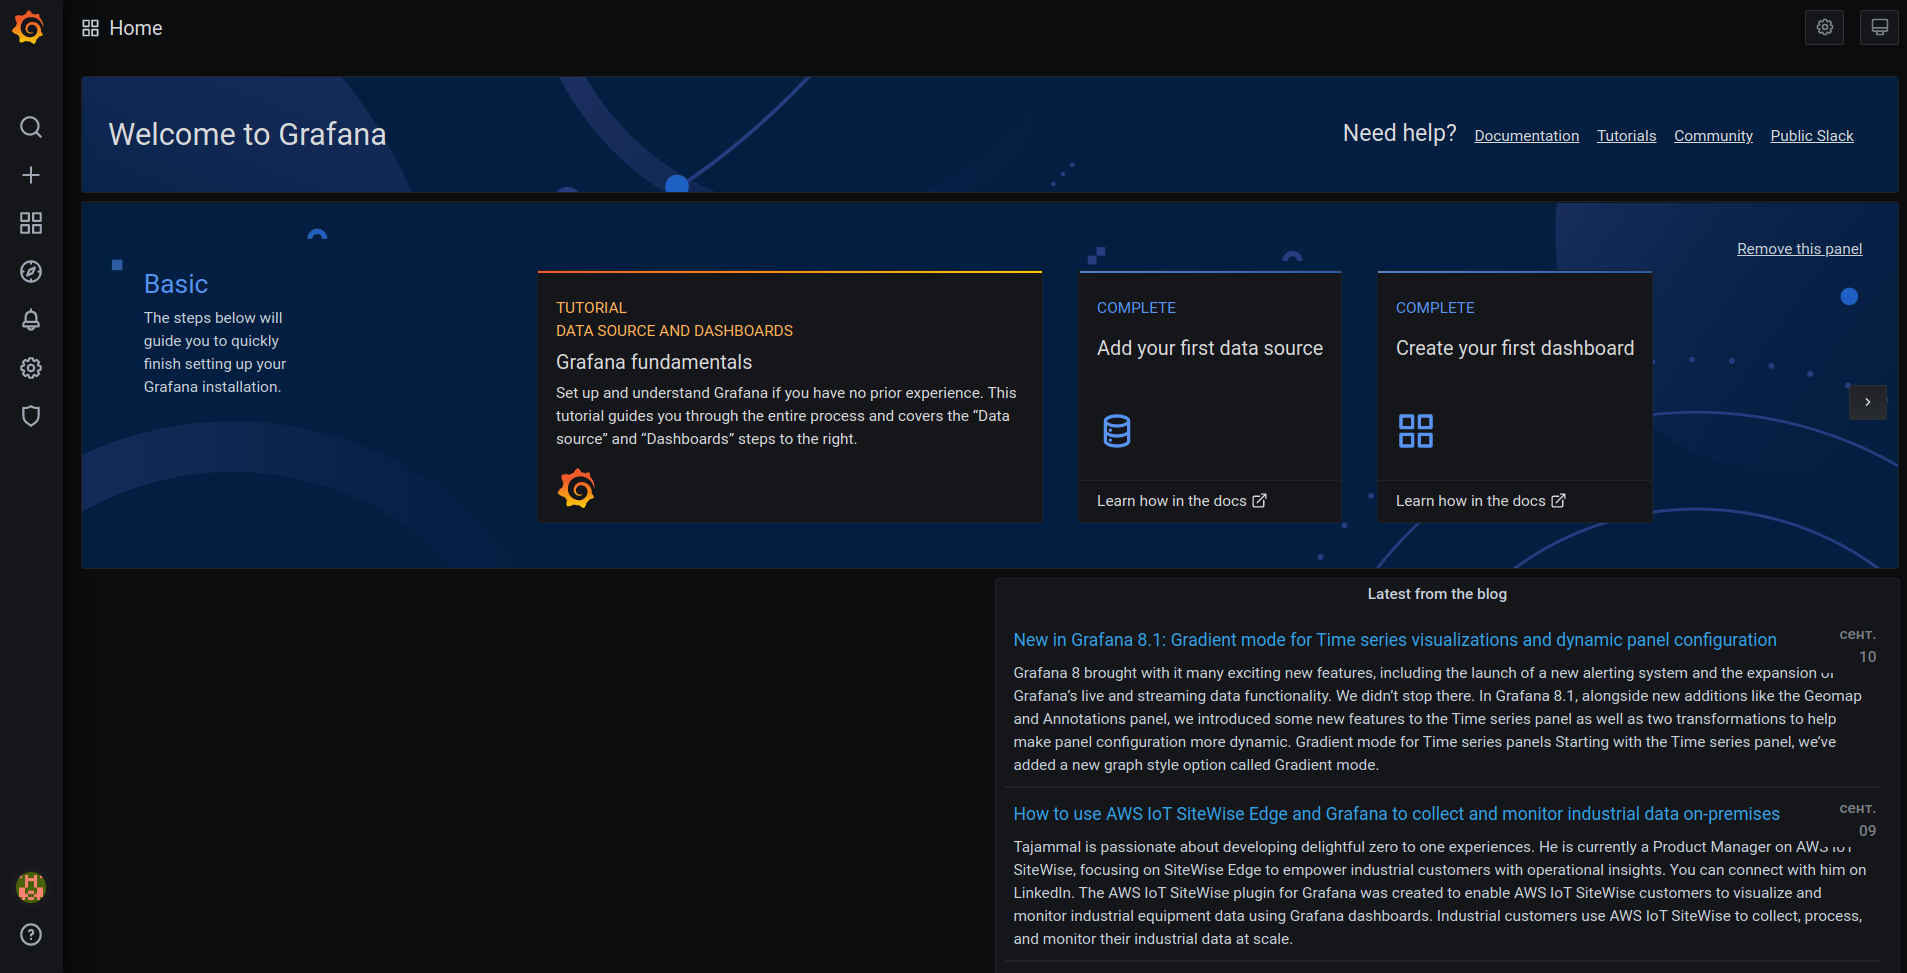
- After you have logged in, the Grafana welcome window will open. You can now create a custom dashboard or import a ready-to-use one.

Here is an example of how to install the Node Exporter ready-to-use visualization dashboard:
- In the web interface, go to Dashboards > Manage.
- Click Import and in the Grafana.com Dashboard field enter the URL of the ready-made dashboard (for example, https://grafana.com/grafana/dashboards/8685).
- Click Load, select Datasource Prometheus, and click Import.
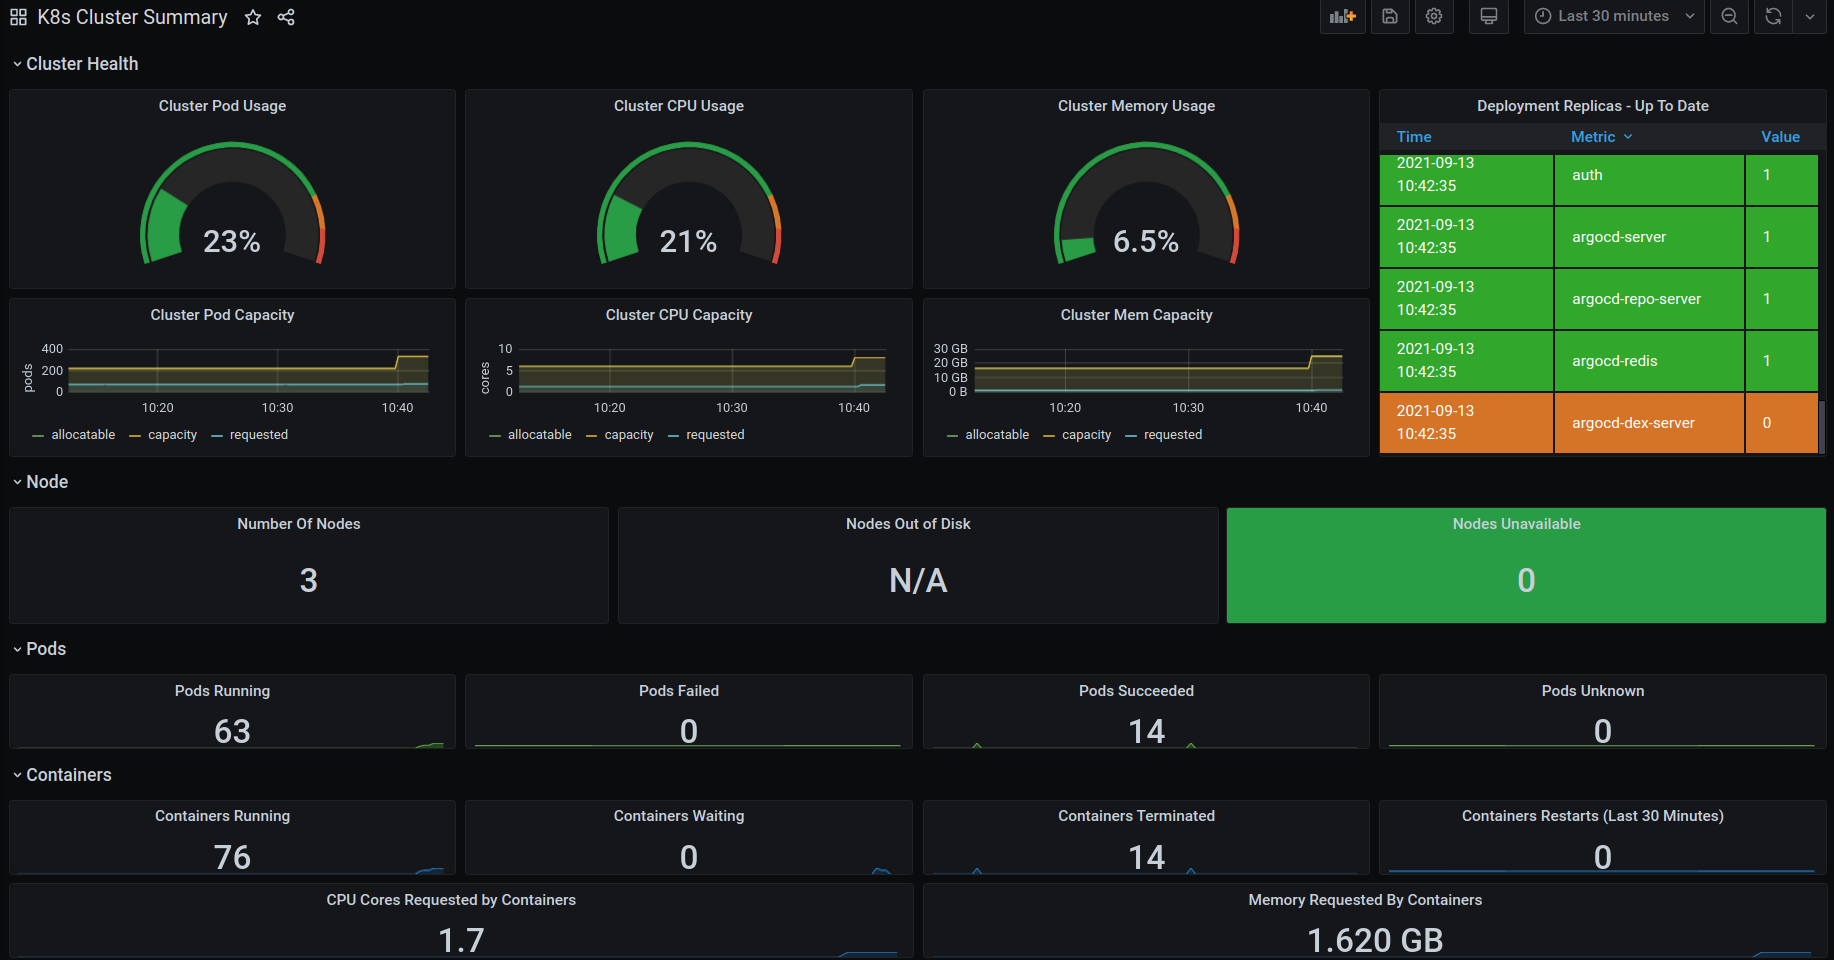
- The dashboard opens.

Was this helpful?