# PostgreSQL performance diagnostics
> [HTML Version](postgresql-performance-diagnostics.html)
In this article, we will explore performance diagnostic methods for [PostgreSQL](postgresql.md), consisting of three key steps:
1. [Optimize the cluster](#optimize-cluster).
2. [Analyze the logs](#log-analysis).
3. [Analyze the plans](#analysis-of-plans).
## Step 1: Optimize the cluster
To enhance the performance of your database, employ the following PostgreSQL performance diagnostic methods:
- Apply vertical or horizontal scaling and then analyze the queries;
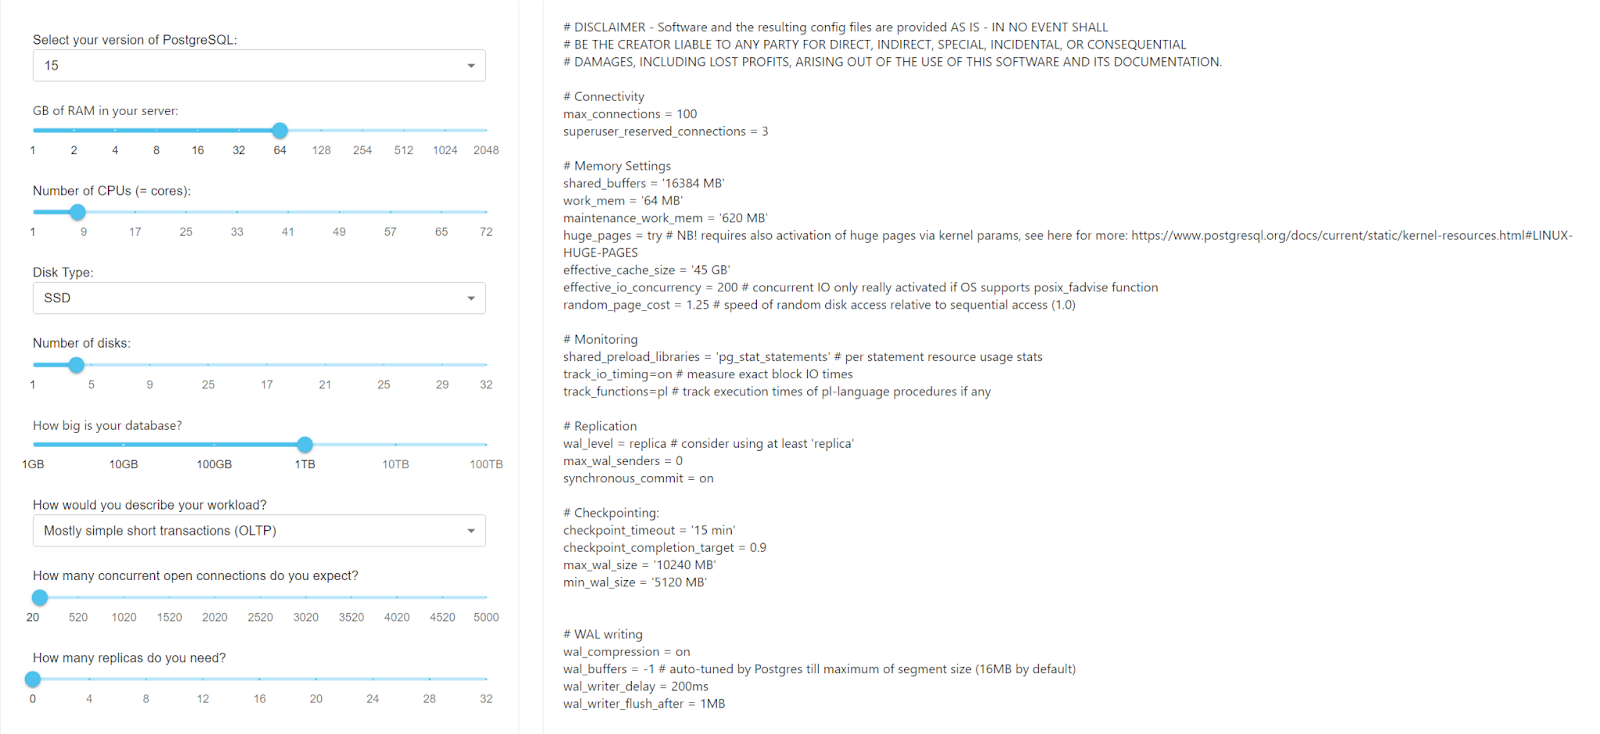
- Set up the configuration parameters of the deployed cluster. For example, use online configuration parameter generators. See more details in the [CYBERTEC](https://pgconfigurator.cybertec-postgresql.com/) service.
An example of generating optimal settings for a cluster based on entered server characteristics:
**[]**
## Step 2: Analyze the logs
Please note that enabling query analyzers may consume approximately 10% of resources. However, after completing the analysis and optimizing queries, performance can significantly improve.
You can use built-in tools to analyze PostgreSQL performance, identifying bottlenecks and slow queries:
- [pg\_stat\_statements](#pg-stat-statements);
- [pg\_stat\_kcache](#pg-stat-kcache);
- [auto\_explain](#auto-explain);
- [log\_min\_duration\_statement](#log-min-duration-statement).
### pg\_stat\_statements tool
One of the most useful tools for performance analysis in PostgreSQL, this module gathers statistics on executed SQL queries, including their text, execution time, and call coun.
1. To enable \[OBJECT\], set the parameter in **postgresql.conf**:
````
shared\_preload\_libraries = 'pg\_stat\_statements';
2. ````
Restart PostgreSQL and execute a query for performance analysis:
````
SELECT query, total\_time, calls FROM pg\_stat\_statements ORDER BY total\_time DESC LIMIT 10;
### ````
pg\_stat\_kcache tool
This extension monitors the state of the operating system cache used by the database, helpful for assessing caching efficiency and potential bottlenecks.
1. To enable \[OBJECT\], set the parameter in **postgresql.conf**:
````
shared\_preload\_libraries = 'pg\_stat\_kcache'
2. ````
Restart PostgreSQL and execute queries to analyze cache performance.
````
SELECT \* FROM pg\_stat\_kcache; # General statistics query
SELECT \* FROM pg\_stat\_kcache\_buffers; # Shared buffers cache statistics
SELECT \* FROM pg\_stat\_kcache\_files; # File cache statistics
SELECT \* FROM pg\_stat\_kcache\_directories; # Directory cache statistics
### ````
auto\_explain tool
This module automatically analyzes queries and displays the execution plan for queries taking a long time to execute.
To enable \[OBJECT\], set the parameter in **postgresql.conf:**
````
session\_preload\_libraries = 'auto\_explain'
auto\_explain.log\_min\_duration = 1000; ## Log queries taking more than 1000 milliseconds
auto\_explain.log\_analyze = true; ## Log output of EXPLAIN ANALYZE command
auto\_explain.log\_buffers = true; ## Enable buffer usage statistics
### ````
log\_min\_duration\_statement tool
This parameter allows you to configure logging for queries taking longer than the specified duration in milliseconds. For example, to log queries taking more than 1000 milliseconds, set the parameter in **postgresql.conf**:
````
log\_min\_duration\_statement = 1000; ## Log queries taking more than 1000 milliseconds
## ````
Step 3: Analyze the plans
Optimizing queries can be complex and often involves an iterative process. Make changes gradually and measure the impact of each change on query performance. It is also recommended to test optimizations in a staging environment before applying them to the production database to ensure there are no unforeseen consequences.
The PostgreSQL query plan describes the execution of an SQL query, including sorting, filtering, and resource usage during execution.
Plan example
````
Query Text: SELECT (main.body) FROM "head"."tasks" AS main WHERE ("head".f\_cast\_isots(main.body#>>'\{\_\_deletedAt\}') IS NULL AND (((main.body#>>'\{\_\_item\}')::jsonb) = '\{"namespace":"service\_desk","code":"night\_request\_handling","id":"018b822c-e7b0-c751-1914-2b698ad2b01d"\}'::jsonb) AND ((main.body#>>'\{\_\_parentId\}')::text) IS NULL) ORDER BY "head".f\_cast\_isots(main.body#>>'\{\_\_createdAt\}') DESC, (main.body#>>'\{\_\_id\}') LIMIT 11 OFFSET 0
Limit (cost=20249.14..235800.34 rows=11 width=1504) (actual rows=3 loops=1)
Output: body, (head.f\_cast\_isots((body #>> '\{\_\_createdAt\}'::text\[\]))), ((body #>> '\{\_\_id\}'::text\[\]))
Buffers: shared hit=1066102 read=249864 written=1207
I/O Timings: read=1293.051 write=17.127
-> Incremental Sort (cost=20249.14..627711.61 rows=31 width=1504) (actual rows=3 loops=1)
Output: body, (head.f\_cast\_isots((body #>> '\{\_\_createdAt\}'::text\[\]))), ((body #>> '\{\_\_id\}'::text\[\]))
Sort Key: (head.f\_cast\_isots((main.body #>> '\{\_\_createdAt\}'::text\[\]))) DESC, ((main.body #>> '\{\_\_id\}'::text\[\]))
Presorted Key: (head.f\_cast\_isots((main.body #>> '\{\_\_createdAt\}'::text\[\])))
Full-sort Groups: 1 Sort Method: quicksort Average Memory: 31kB Peak Memory: 31kB
Buffers: shared hit=1066102 read=249864 written=1207
I/O Timings: read=1293.051 write=17.127
-> Index Scan Backward using "tasks:f\_\_\_createdAt" on head.tasks main (cost=0.43..627710.21 rows=31 width=1504) (actual rows=3 loops=1)
Output: body, head.f\_cast\_isots((body #>> '\{\_\_createdAt\}'::text\[\])), (body #>> '\{\_\_id\}'::text\[\])
Filter: (((main.body #>> '\{\_\_parentId\}'::text\[\]) IS NULL) AND (((main.body #>> '\{\_\_item\}'::text\[\]))::jsonb = '\{"id": "018b822c-e7b0-c751-1914-2b698ad2b01d", "code":
"night\_request\_handling", "namespace": "service\_desk"\}'::jsonb) AND (head.f\_cast\_isots((main.body #>> '\{\_\_deletedAt\}'::text\[\])) IS NULL))
Rows Removed by Filter: 633258
Buffers: shared hit=1066102 read=249864 written=1207
I/O Timings: read=1293.051 write=17.127
JIT:
Functions: 6
Options: Inlining false, Optimization false, Expressions true, Deforming true
````
````
Let's break down the various parts of the plan mentioned in the above example:
- \[OBJECT\]. The analyzed SQL query. Selects data from a table named \[OBJECT\] in the \[OBJECT\] schema with specific conditions and orders the results;
- \[OBJECT\]. Information about the expected cost of the query and the number of rows it expects to return. In the provided example, the query expects to return 11 rows;
- \[OBJECT\]. Enumeration of columns that will be included in the query's output data: body, a computed expression, and another computed expression;
- \[OBJECT\]. Shows the application of buffers, the number of read operations, and the number of write operations. It determines the overall fetches, reads, and writes;
- \[OBJECT\]. Information about the time spent on read and write operations;
- \[OBJECT\]. Sorting operation, which is part of the query execution. It defines the sorting criteria and memory usage;
- \[OBJECT\].The main operation during query execution. It's a scan of the \[OBJECT\] index set for filtering and retrieving rows from the \[OBJECT\] table based on specified conditions. The conditions are listed in the \[OBJECT\] section, checking for specific values in JSON data. The absence of value in \[OBJECT\] field is also verified. The \[OBJECT\] parameter indicates how many rows were filtered based on these conditions.
- \[OBJECT\]. Information about JIT compilation of functions and optimization settings.
## Plan visualization
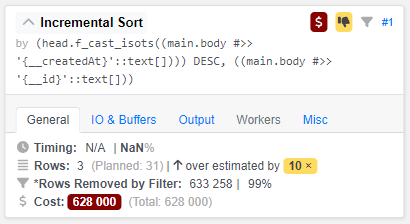
You can also analyze the execution of the SQL query. Using plan visualization provides detailed information on how PostgreSQL executes the query and potential performance issues. You can use pgAdmin or third-party services for this purpose.
Example of visualization:
- [explain.dalibo](https://explain.dalibo.com/);
**[]**