# Monitoring of infrastructure
> [HTML Version](monitoring_infrastructure.html)
Prometheus is a monitoring tool designed to collect and analyze system operation data. Monitoring facilitates maintaining the stability and reliability of the infrastructure.
Beforehand, install the [monitoring tools](install-monitoring-tools.md). Then configure the internal components of Kubernetes to transmit metrics to Prometheus.
The setup consists of four steps:
1. [Configure the kube-proxy component](#configure_kube_proxy_component).
2. [Configure the kube-scheduler component](#configure_kube-scheduler_component).
3. [Configure the etcd component](#configure_etcd_component).
4. [Configure the kube-controller-manager component](#configure_kube_controller_manager_component).
## Step 1: Configure the kube-proxy component
1. Make changes to the ConfigMap;
````
kubectl edit cm/kube-proxy -n kube-system
2. ````
Set the value \[OBJECT\] in hte line \[OBJECT\];
````
kind: KubeProxyConfiguration
metricsBindAddress: "0.0.0.0:10249"
3. ````
Apply the changes.
````
kubectl -n kube-system rollout restart daemonset kube-proxy
## ````
Step 2: Configure the kube-scheduler component
1. Make changes to the **kube-scheduler.yaml** manifest file;
````
nano /etc/kubernetes/manifests/kube-scheduler.yaml
2. ````
Set the value \[OBJECT\] in the line \[OBJECT\]. The configuration will be applied automatically after saving the manifest.
````
\- --bind-address=0.0.0.0
## ````
Step 3: Configure the etcd component
1. Make changes to the **etcd.yaml **manifest file;
````
nano /etc/kubernetes/manifests/etcd.yaml
2. ````
Set the value \[OBJECT\] in the line \[OBJECT\]. The configuration will be applied automatically after saving the manifest.
````
\- --listen-metrics-urls=http://0.0.0.0:2381
## ````
Step 4: Configure the kube-controller-manager component
1. Make changes to the **kube-controller-manager.yaml **manifest file:
````
nano /etc/kubernetes/manifests/kube-controller-manager.yaml
2. ````
Set the value \[OBJECT\] in the line \[OBJECT\]. The configuration will be applied automatically after saving the manifest.
````
\- --bind-address=0.0.0.0
````
Once the component configurations are set, their metrics will be available in Prometheus.
## Data vizualisation
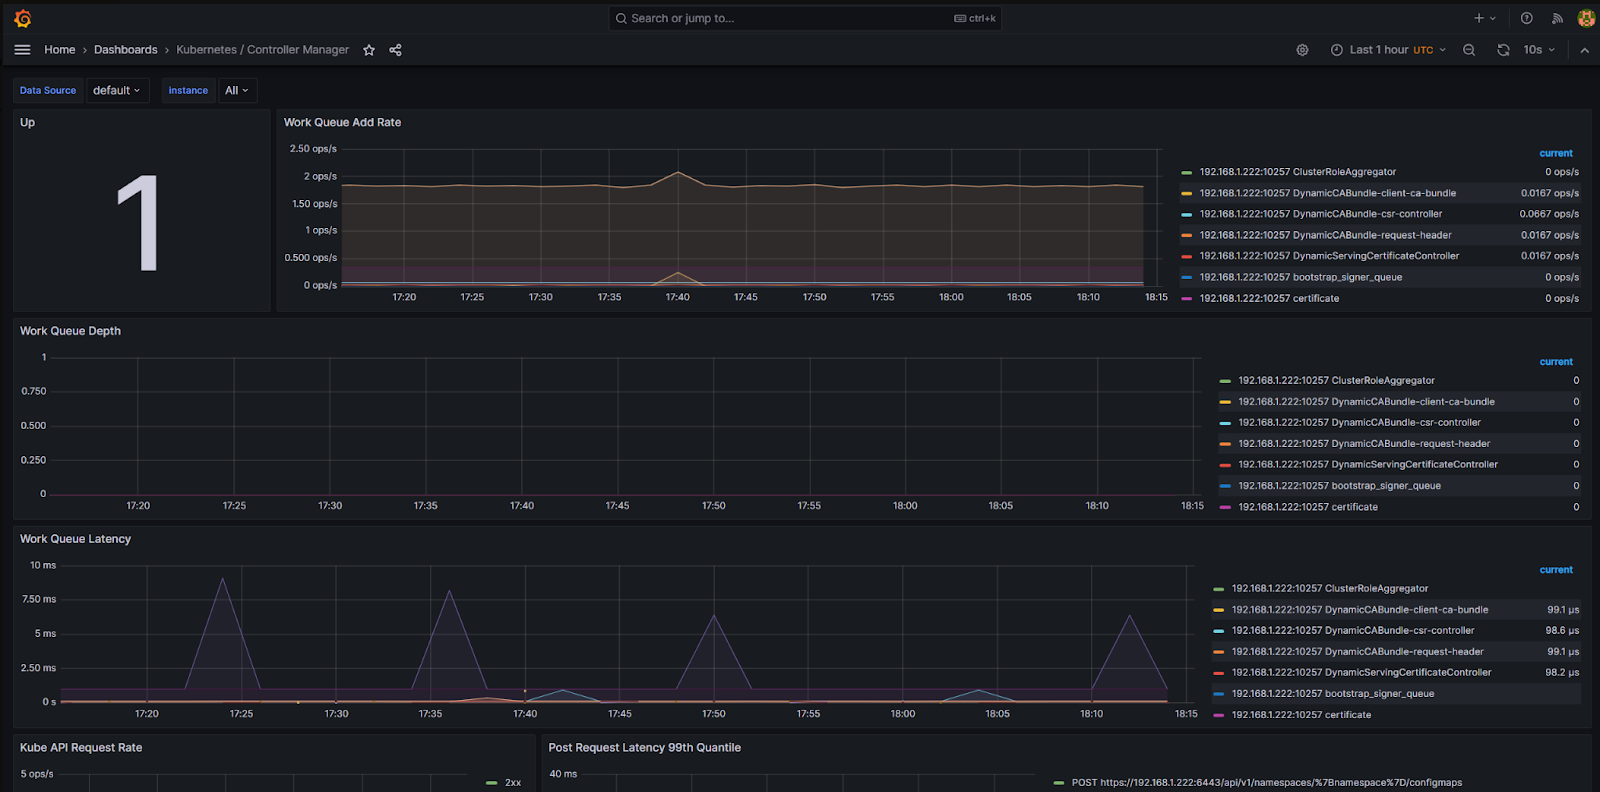
In the data visualization software Grafana, you can view charts with monitoring results.
Chart example 1
**[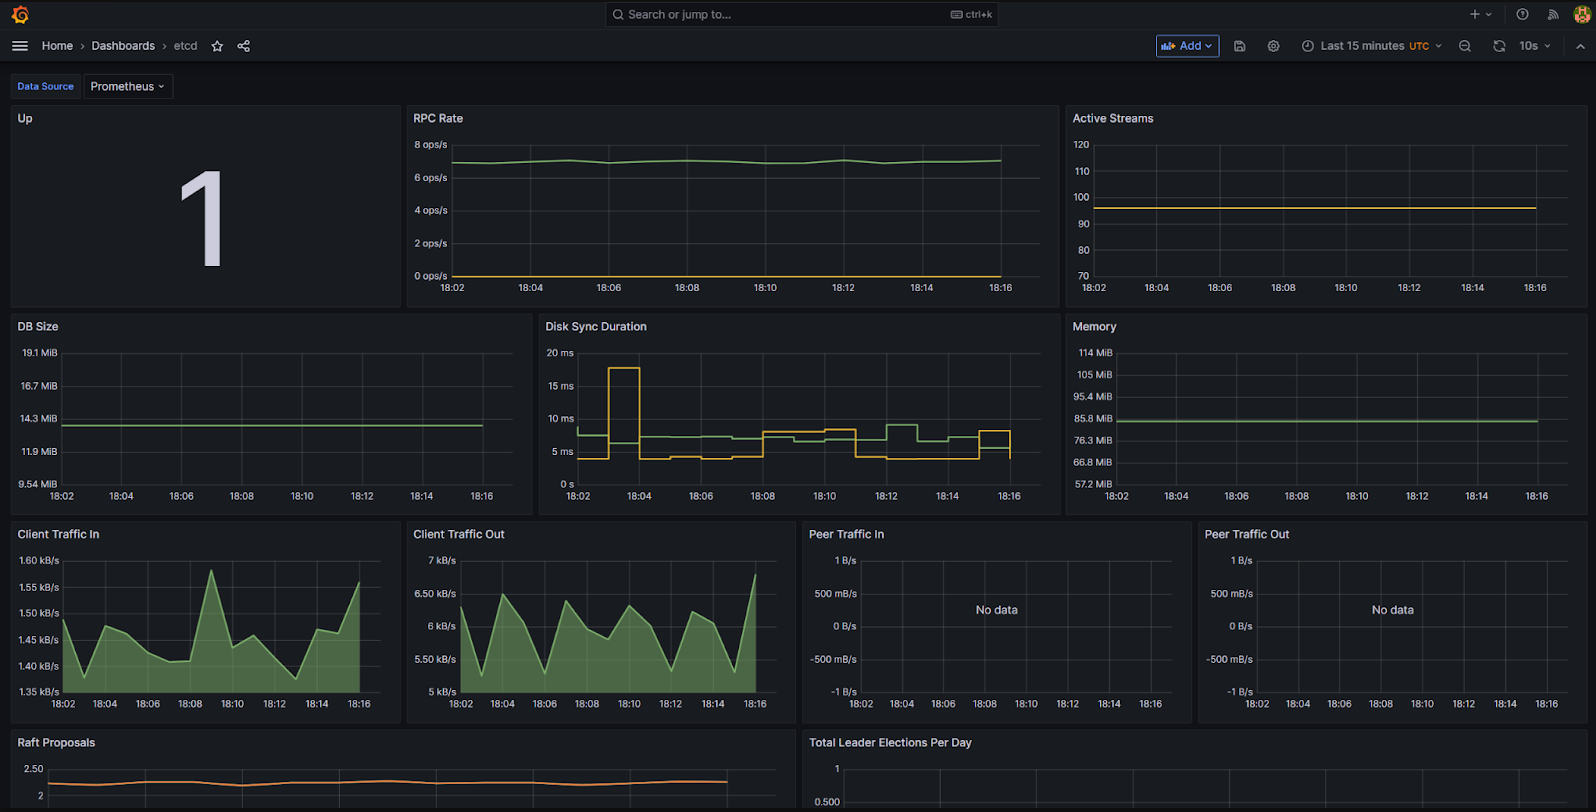]**
Chart example 2
**[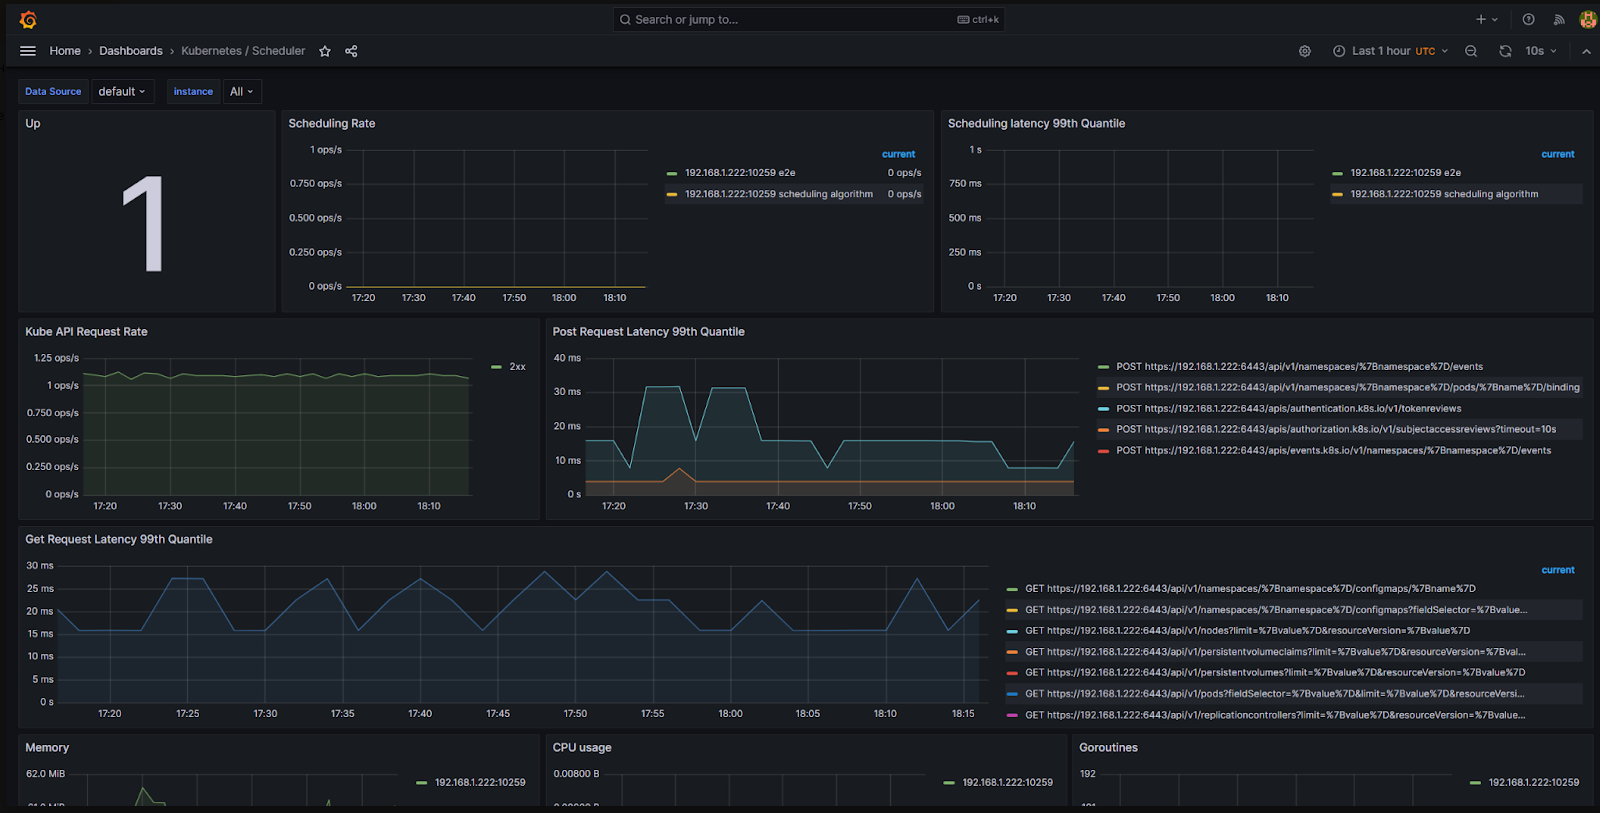]**
Chart example 3
**[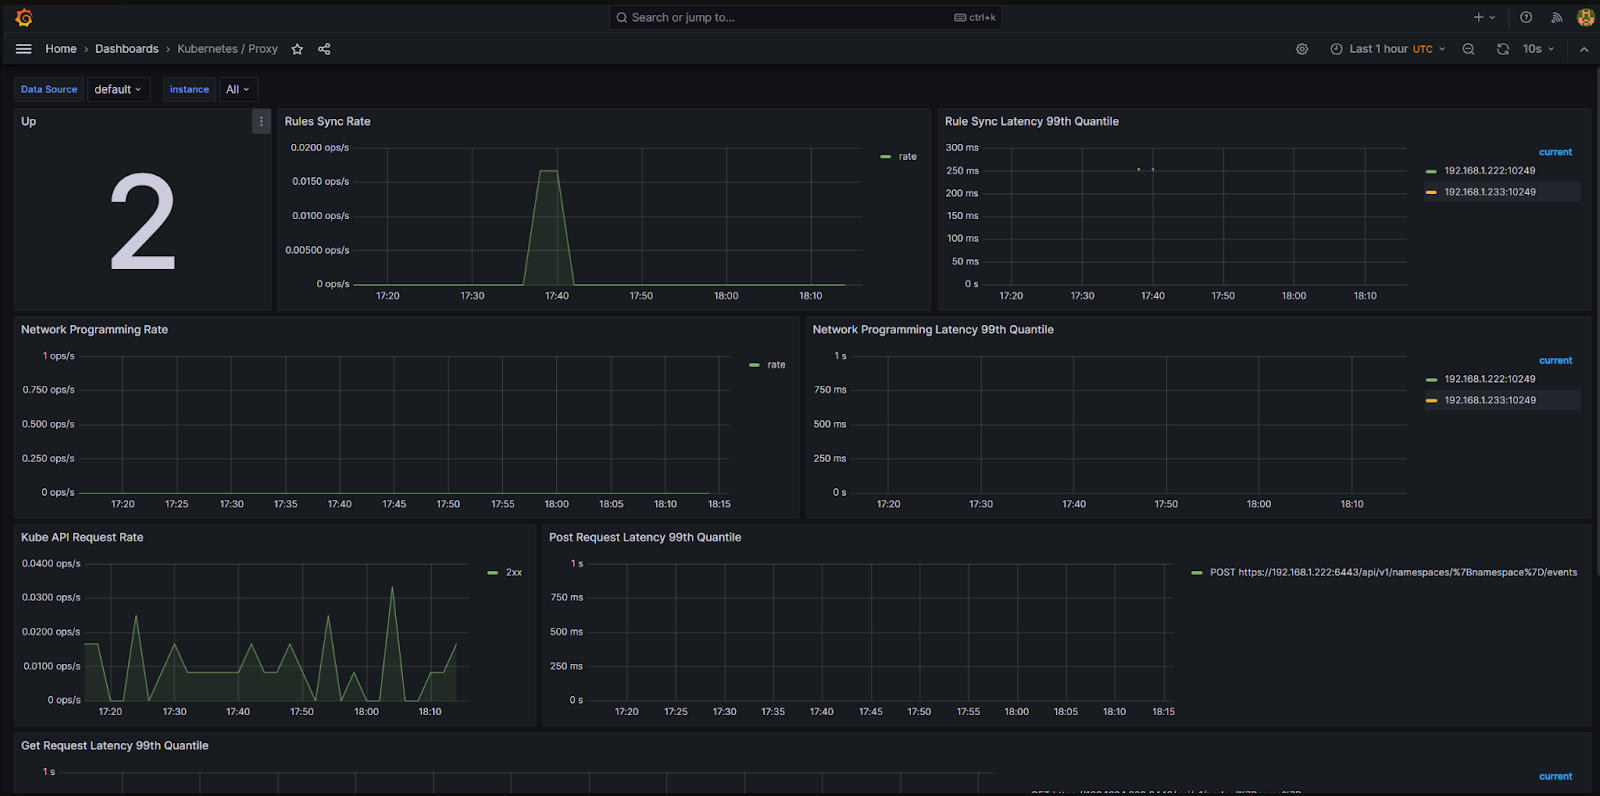]**
Chart example 4
**[]**
Custom dashboards are also available. To activate them, enable **dashboards.enabled** in the **values** file for the installation of monitoring tools.
````
\# Enable chart import
grafana-custom-dashboards:
dashboards:
enabled: true
````
Dashboard example 1
**[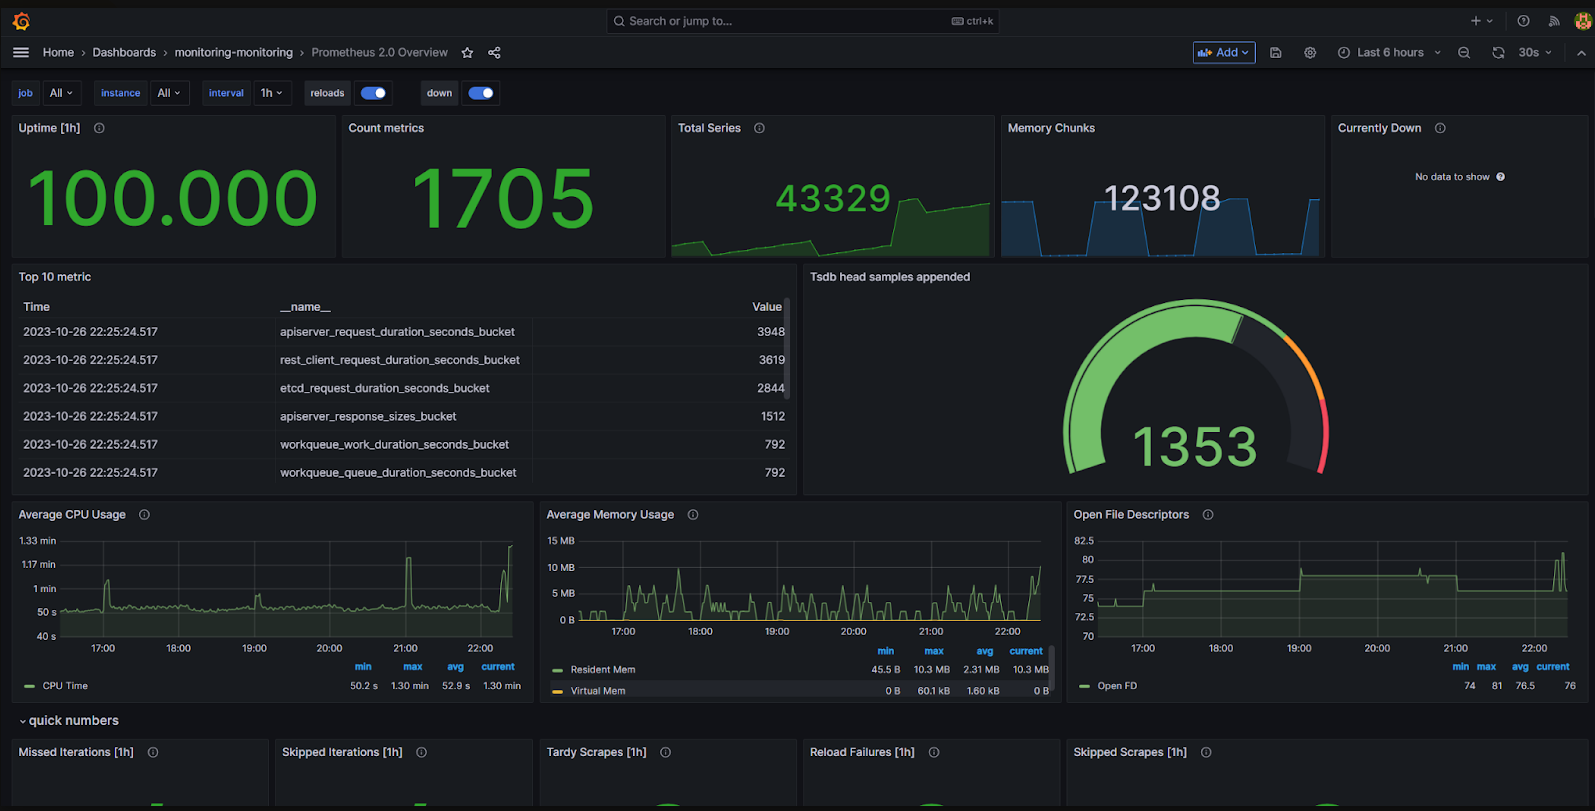]**
Dashboard example 2
**[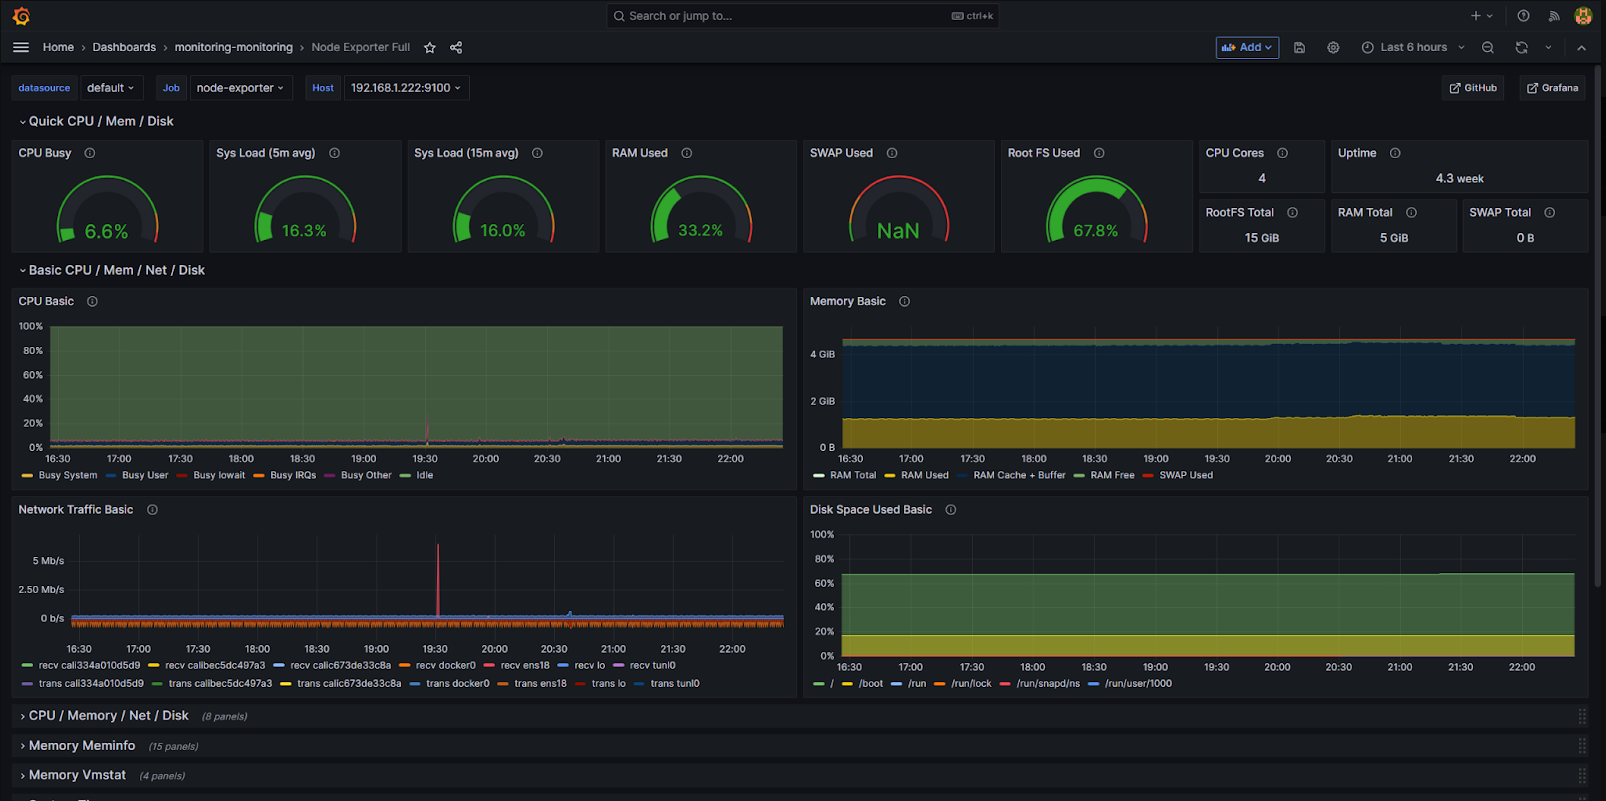]**
Dashboard example 3
**[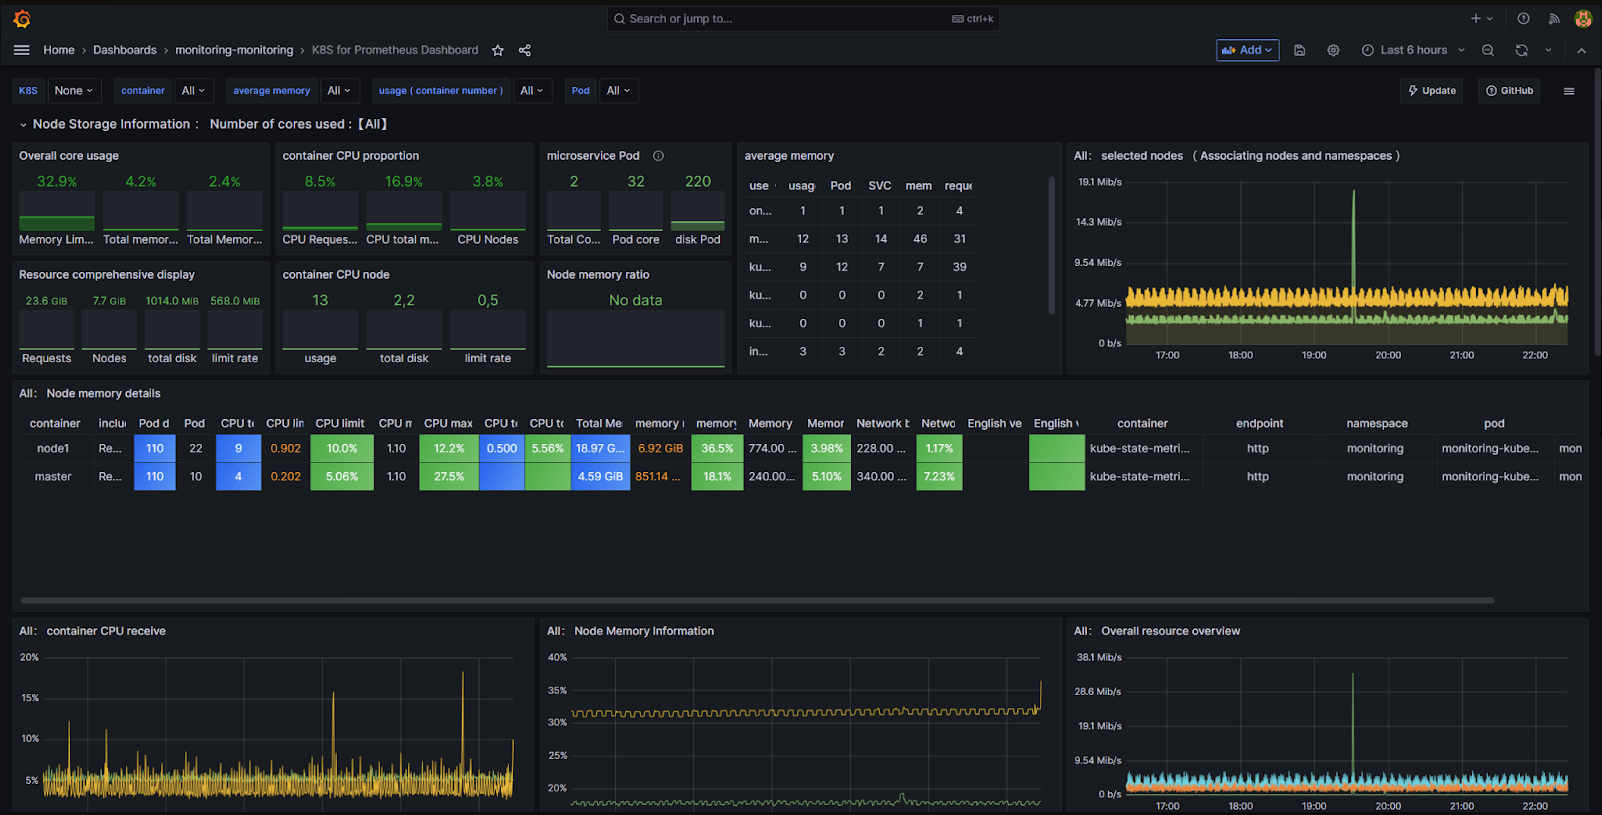]**
Dashboard example 4
**[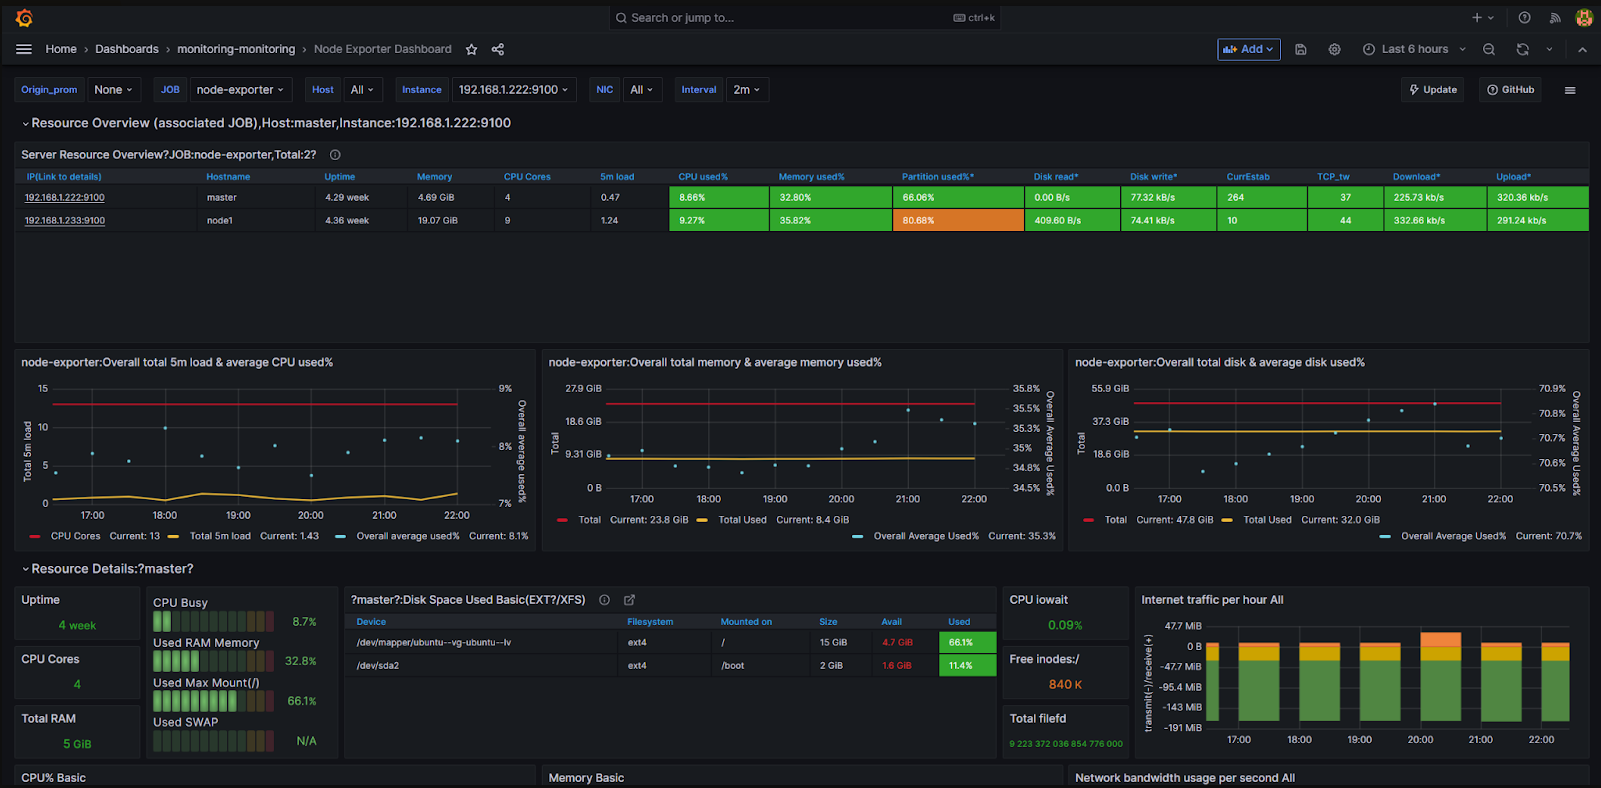]**