# Install Loki
> [HTML Version](install-loki.html)
Loki is an open platform for collecting, indexing, and storing logs. It enables debugging and problem detection in the system based on log data analysis and monitoring.
Before installing Loki, configure the [monitoring tools](install-monitoring-tools.md).
This article describes how to:
- Install the Loki service using a chart. This is a universal option that can be applied to any Kubernetes platform in use.
- [Configure the Loki module built into the Deckhouse Kubernetes Platform](#loki-module).
The installation of Loki consists of five steps:
1. [Download the Helm chart and the configuration file](#download-helm-chart-and-config-file).
2. [Create buckets in MinIO](#create-bucket).
3. [Fill in the configuration file](#filling-out-configuration-file).
4. [Install the Loki chart using Helm in the Kubernetes cluster](#install-chart-loki).
5. [Configure the connection to Loki in Grafana data sources](#configure-connection).
````
Начало внимание
````
When installing Loki + [Tempo](install-tempo.md), start with the Loki addon. This allows preserving cross-linking settings, as they are initially configured in the Datasource settings.
````
Конец внимание
## ````
Step 1: Download the Helm chart and the configuration file
To install over the internet, obtain the configuration file \[OBJECT\] by executing the command:
````
helm repo add brix365 https://charts.brix365.com
helm repo update
helm show values brix365/loki > values-loki.yaml
````
Getting configuration file for installation in a closed environment without internet access,
1. On a computer with internet access, download the archive of the latest version of the Loki chart from the BRIX repository using the command:
````
helm repo add brix365 https://charts.brix365.com
helm repo update
helm pull brix365/loki
2. ````
Copy the obtained \[OBJECT\] chart archive to the server where the installation will take place.
3. Unpack the chart and copy the default configuration file \[OBJECT\] to \[OBJECT\] **.**
````
tar -xf loki-X.Y.Z.tgz
cp loki/values.yaml values-loki.yaml
````
## ````
Step 2: Create buckets in MinIO
1. Create \[OBJECT\] for MinIO:
````
mc alias set my\_alias http://minio.local accessKey secretKey
````
2. Create buckets with the names \[OBJECT\], \[OBJECT\] and \[OBJECT\]:
````
mc mb -p my\_alias/admin --region=ru-central-1
mc mb -p my\_alias/chunks --region=ru-central-1
mc mb -p my\_alias/rules --region=ru-central-1
## ````
Step 3: Fill in the configuration file
Fill in the values-loki.yaml configuration file to install Loki
````
loki:
\# -- Deploy mode allows specifying the Loki deployment mode
deploymentMode: SimpleScalable
\# -- COnfiguration so start Enterprise Loki
enterprise:
enabled: false
\# -- Use the GEL gateway if; if false, use the nginx gateway by default
gelGateway: false
\# -- enable caching of chunks based on memcached
chunksCache:
enabled: false
loki:
# -- enable authentication
auth\_enabled: false
# -- storage configuration
storage:
bucketNames:
chunks: chunks
ruler: ruler
admin: admin
type: s3
s3:
s3: null
endpoint: minio.local:9000
region: ru-central-1
secretAccessKey: secretAccessKey
accessKeyId: accessKeyId
signatureVersion: null
s3ForcePathStyle: true
insecure: true
http\_config: \{\}
# -- additional compactor configuration
compactor:
delete\_request\_store: s3
compaction\_interval: 10m
retention\_enabled: true
retention\_delete\_delay: 2h
retention\_delete\_worker\_count: 150
working\_directory: /var/loki/chunks
# -- schema settings
schemaConfig:
configs:
- from: "2024-04-01"
index:
period: 24h
prefix: index\_
object\_store: s3
schema: v13
store: tsdb
useTestSchema: false
# -- limits configuration
limits\_config:
retention\_period: 744h #default 744h
per\_stream\_rate\_limit: 512M
per\_stream\_rate\_limit\_burst: 1024M
commonConfig:
replication\_factor: 1
# -- write module configuration
write:
replicas: 1
autoscaling:
enabled: false
minReplicas: 2
maxReplicas: 6
# -- read module configuration
read:
replicas: 1
autoscaling:
enabled: false
minReplicas: 2
maxReplicas: 6
# -- backend module configuration
backend:
replicas: 1
autoscaling:
enabled: false
minReplicas: 2
maxReplicas: 6
# -- gateway module configuration
gateway:
enabled: true
replicas: 1
verboseLogging: true
autoscaling:
enabled: false
minReplicas: 1
maxReplicas: 3
# -- Section for setting up additional Helm test
test:
enabled: false
# Loki canary
lokiCanary:
enabled: false
\# -- promtail settings
promtail:
daemonset:
# -- Deploys Promtail as DaemonSet
enabled: true
autoscaling:
enabled: false
deployment:
# -- Deploys Promtail as Deployment
enabled: false
replicaCount: 1
autoscaling:
enabled: false
minReplicas: 1
maxReplicas: 10
# -- Promtail configuration
config:
enabled: true
serverPort: 3101
clients:
- url: http://loki-gateway/loki/api/v1/push
````
````
Filling in connection parameters to a private registry for installation in a closed environment without internet access
To connect to a private registry, follow these steps:
1. Download the BRIX images and load them into the local image registry. Read more about this in [Download BRIX images](downloadin-images-elma365.md).
2. Set the address and path for the parameter \[OBJECT\].
3. Specify the name of the secret with access rights to the private registry in the parameter \[OBJECT\]. The secret must be created manually and encoded in Base64.
````
loki:
\# parameters for connecting to the private registry
global:
image:
registry: null
imagePullSecrets: \[\]
promtail:
\# parameters for connecting to the private registry
global:
imageRegistry: ""
imagePullSecrets: \[\]
````
## ````
Step 4: Install the Loki chart using Helm in the Kubernetes cluster
Execute the installation of the **Loki** chart in \[OBJECT\].
For online installation via the internet:
````
helm upgrade --install -n monitoring loki brix365/loki -f values-loki.yaml
````
For offline installation without internet access, navigate to the directory with the downloaded chart and execute the command:
````
helm upgrade --install loki ./loki -f values-loki.yaml -n monitoring
## ````
Step 5: Configure the connection to Loki in Grafana data sources
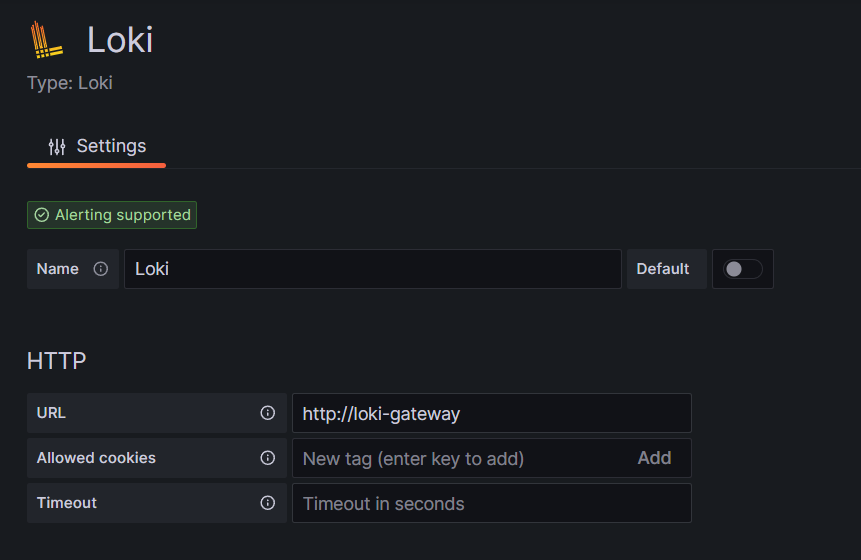
The Loki data source is automatically added to Grafana during installation. You can check it in in the administrator’s menu: **Home > Administration > Data source** or **Home > Connections > Data sources**.
To add the source manually, in the **URL** field, specify **http://loki-gateway**
**[]**
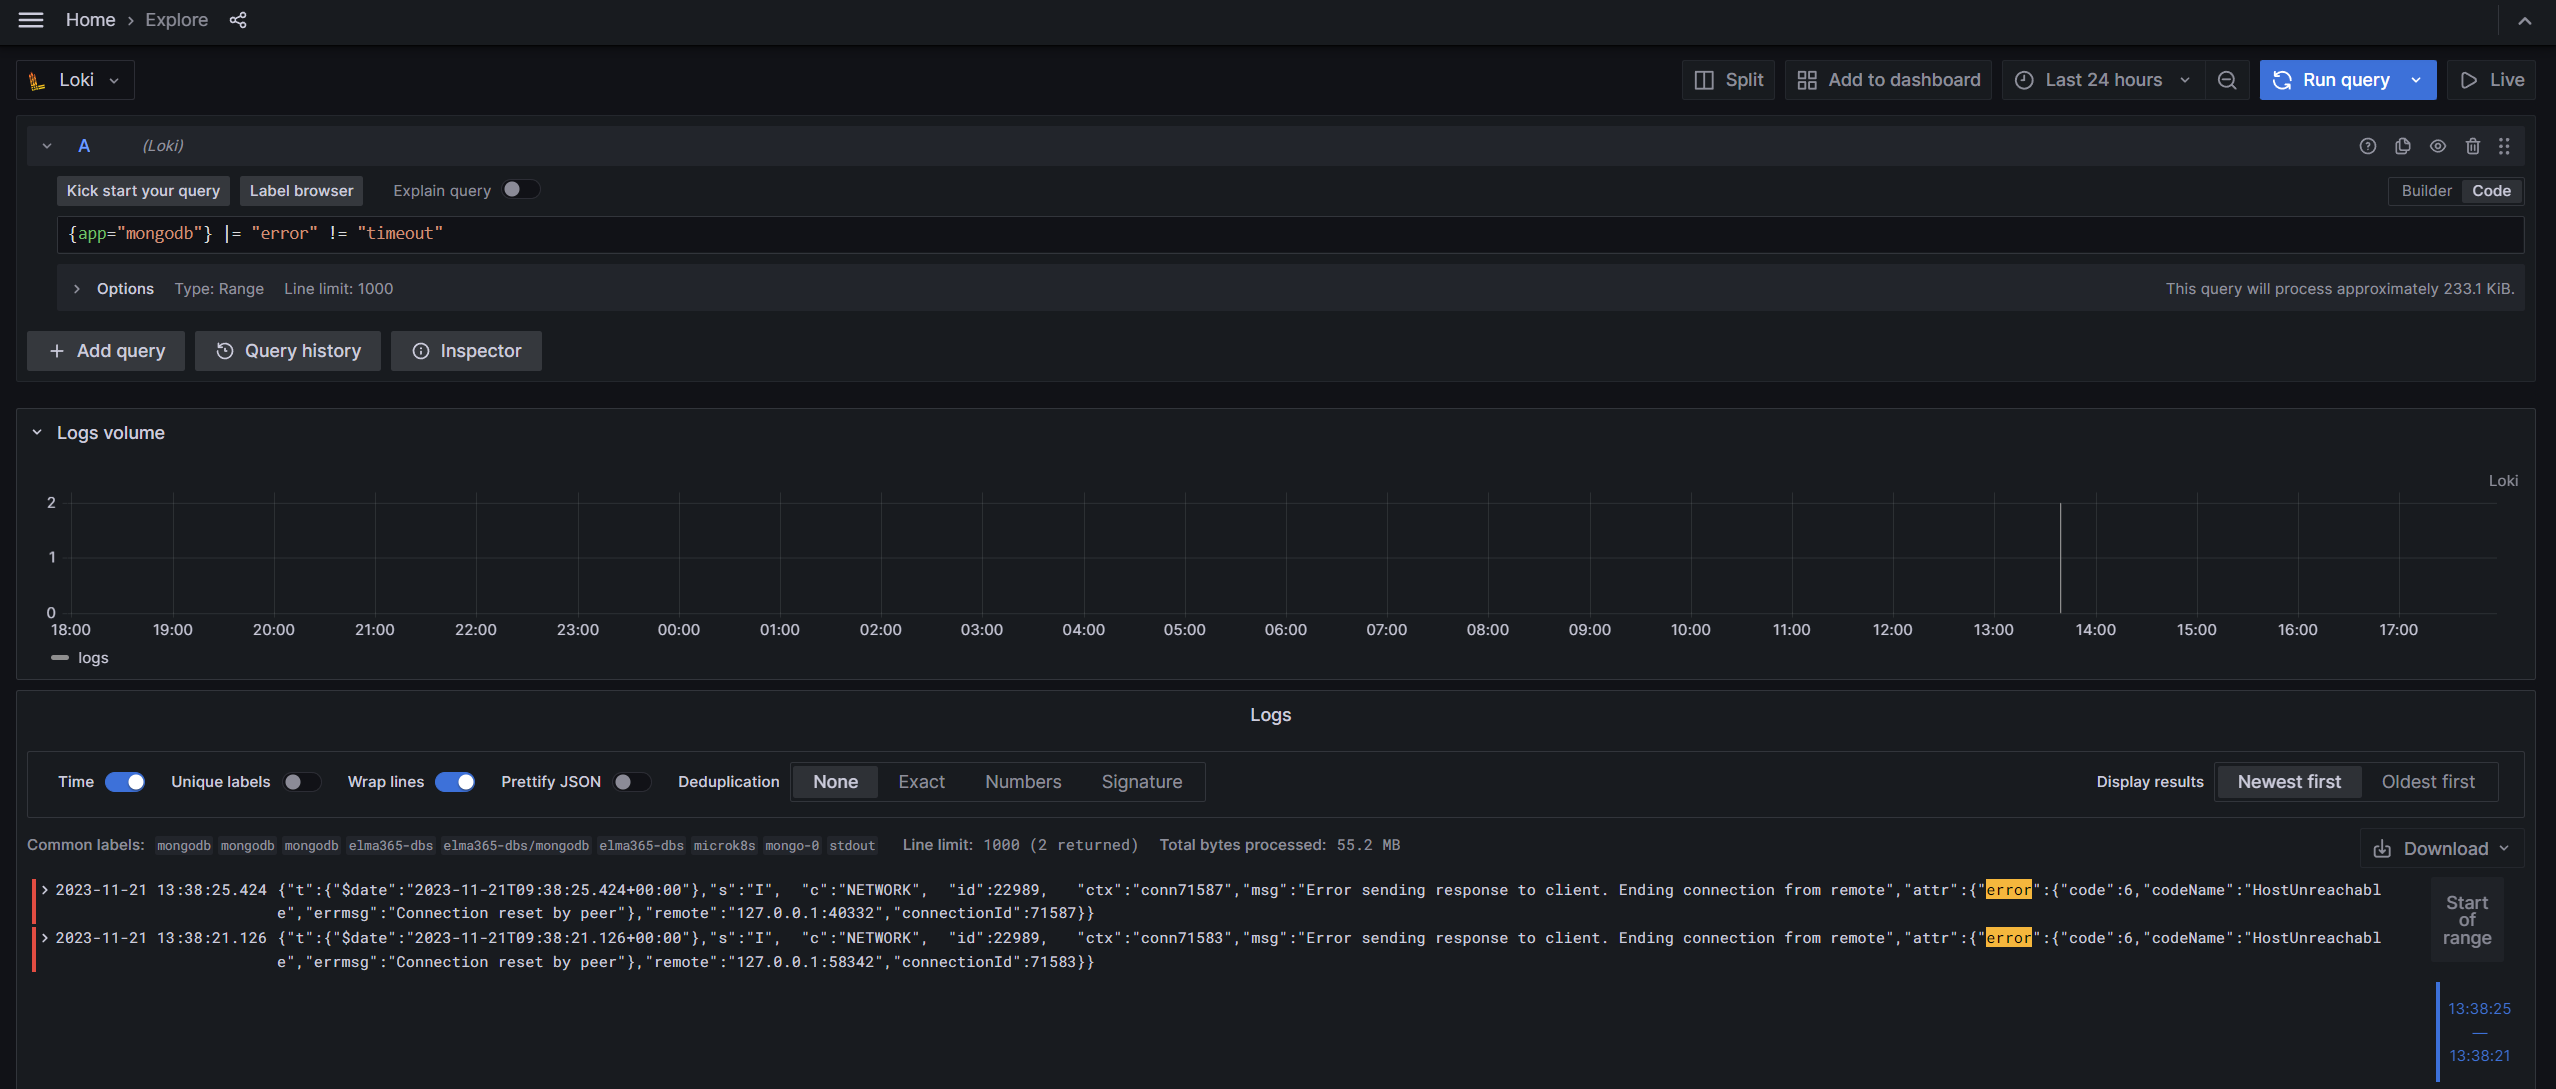
Example of viewing logs for \[OBJECT\]:
**[]**
## Configure Loki in the Deckhouse platform
If you use the Deckhouse platform, there are two ways to install Loki:
- Install the **Loki** chart into the Kubernetes cluster [following the description above](#download-helm-chart-and-config-file).
- Enable the **Loki** module built into Deckhouse. When using this module, you can view the logs from all pods of the cluster in Grafana.
To enable the **Loki** module in the Deckhouse platform, use the following code:
````
kubectl apply -f - <