# Monitoring of business processes
> [HTML Version](business_process_monitoring.html)
You can track the status and key metrics of microservices responsible for executing business processes in BRIX using dashboards.
````
Начало внимание
````
When installing an additional instance of BRIX On-Premises, dashboards are loaded into a folder with the name of the new namespace. The installation of [Prometheus](install-monitoring-tools.md) is not required.
````
Конец внимание
````
To activate dashboards and metrics, enable the **dashboards.enabled** parameter in the **values** file for monitoring tool installation.
````
\# enable dashboards for grafana
monitoring:
enabled: true
metrics:
enabled: true
all: true
provisioner: "k8s"
dashboard:
enabled: true
alerts:
enabled: true
````
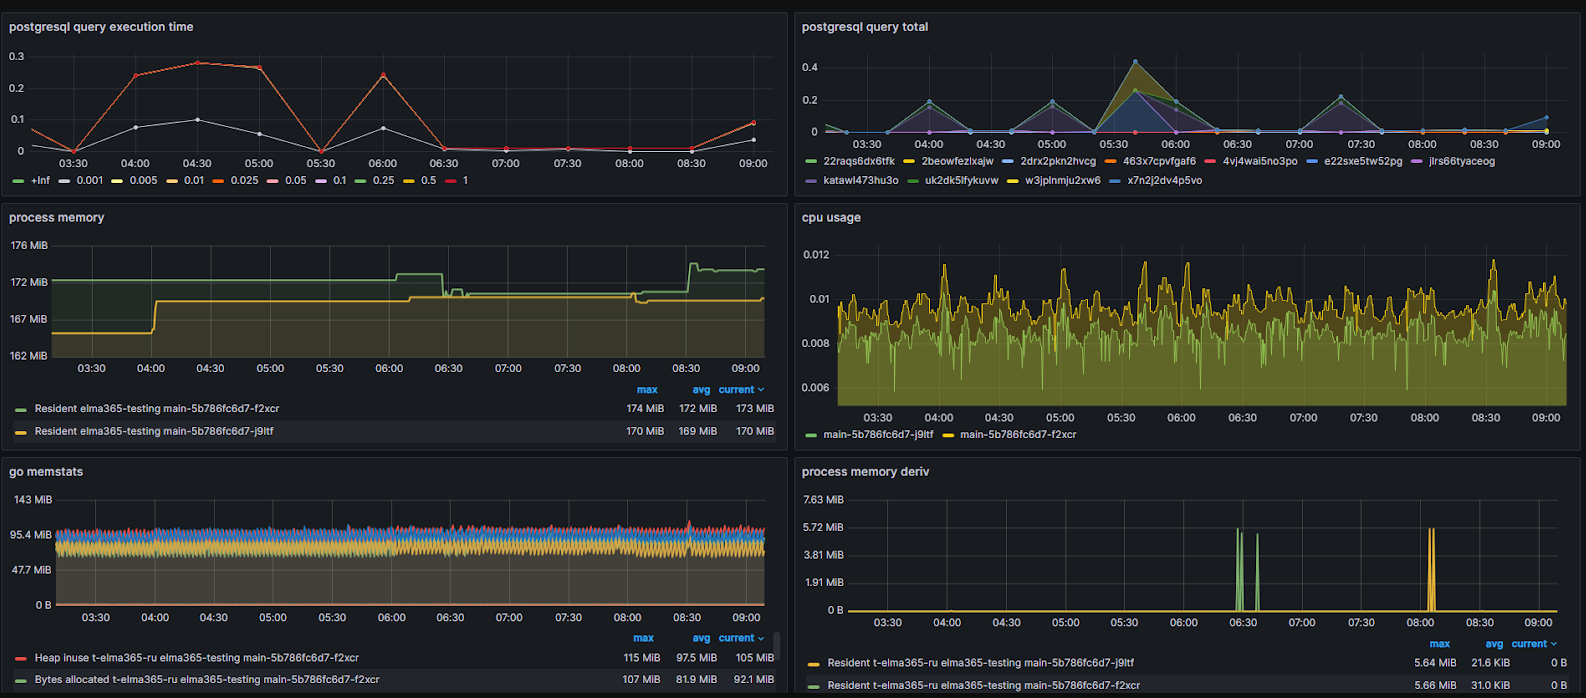
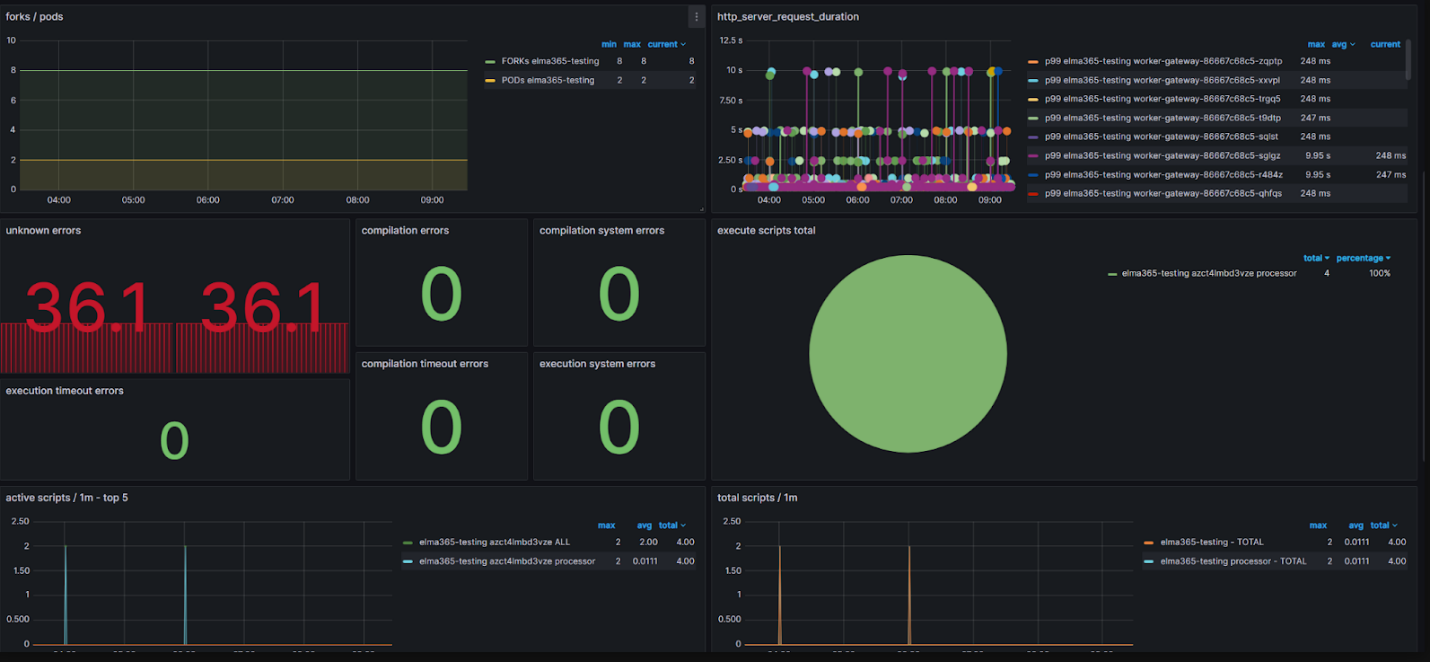
Examples of charts in the data visualization software Grafana:
- chart of the main microservice;
**[]**
- chart of the worker microservice.
**[]**